How to Spot Hidden Grid and Martingale Logic in an MT5 Backtest
Vendors redefine "no martingale" creatively. Here is how to audit the MT5 Deals list, equity curve, and lot sequence in five minutes before risking money.
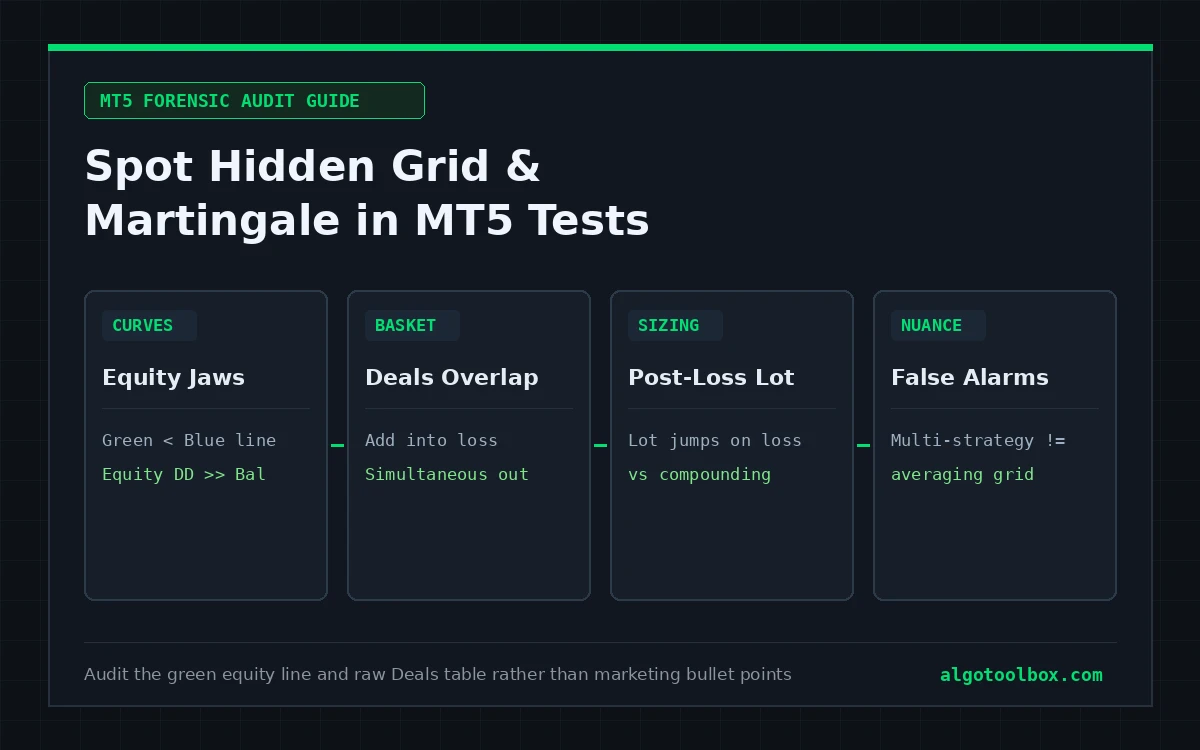
Almost every commercial Expert Advisor listing now leads with the banner “No Grid, No Martingale, Hard Stop-Loss” — which is why knowing how to spot grid and martingale in MT5 test reports yourself matters far more than reading vendor bullet points. Sellers routinely invent narrow personal definitions: an EA that multiplies lot size by 1.6× instead of 2.0× gets marketed as “not martingale (smart recovery),” and an EA that spaces rescue orders by ATR instead of fixed pips gets rebranded as “dynamic cost averaging.”
Fortunately, the MetaTrader 5 Strategy Tester records every open ticket, lot size, stop price, and floating equity dip in plain sight. Even on a closed-source demo where you cannot read a single line of MQL5, five checks across the graph, summary grid, and Deals table expose the real position-sizing engine in minutes.
On this page8 sections
- Separate Four Different Sizing Engines Before Labelling an EA
- Sign 1: “Icicle” Equity Jaws and the Balance-vs-Equity Gap
- Sign 2: Overlapping Entries and Simultaneous Basket Exits in Deals
- Sign 3: Post-Loss Lot Jumps (Sequential Martingale Without a Grid)
- Sign 4: Statistical Fingerprints in the Summary Block
- What Is NOT a Grid or Martingale: Avoiding Common False Alarms
- Where to Go Next
- FAQ
Separate Four Different Sizing Engines Before Labelling an EA
Traders lose money both ways: trusting a disguised martingale until one trend day empties the account, or dismissing a legitimate multi-strategy system simply because it held four positions at once. Start by separating four distinct behaviors that show up across published runs on our Test Reports and Our Builds:
| Engine type | How positions & lots behave | Published MT5 example | Primary failure mode |
|---|---|---|---|
| 1. Averaging grid (with or without lot progression) | Adds new positions in the same direction as price moves against an open losing trade, closing the whole basket at an averaged break-even/profit target. | Icarus Grid Bias MT5 (two-sided grid, 50.81% equity DD vs 16.08% balance DD). |
One un-retraced macro move exhausts free margin while closed balance looks smooth right up to the end. |
| 2. Sequential post-loss recovery (single-order martingale) | Holds only one trade at a time with a real stop-loss, then increases lot size on the next trade after a closed loss to recover prior drawdown. | 15M Gold Scalper with optional recovery ladder on (39.27% DD, Z-Score = -5.17). |
A cluster of 6–10 consecutive stop-outs pushes lot size to the cap or blows the daily loss limit. |
| 3. Multi-strategy / multi-leg concurrent trading | Independent sub-strategies (or breakout levels) open separate positions with individual stops; lots stay fixed or follow closed account balance. | Ghost Scalper MT5 (Ghost A–D, up to 5 open trades, all 9,934 deals at 0.01 lot). |
Correlated exposure when all sub-strategies point the same way during a news spike — not grid averaging. |
| 4. Inverted risk-to-reward (wide stop, small target) | One or two trades with fixed stops, zero averaging, and zero post-loss lot step — but each stop-loss is larger than each take-profit. | My AI Gold MT5 ($40 stop vs $25 target, 72.14% win rate). |
High win rate masks fragility if per-trade risk is cranked up (92.76% DD on its Aggressive preset). |
Sign 1: “Icicle” Equity Jaws and the Balance-vs-Equity Gap
Look at the Strategy Tester chart before reading a single summary ratio. MetaTrader 5 draws two lines: a blue Balance curve (closed trades only) and a green Equity curve (closed balance plus open floating profit or loss).
- Classic averaging-grid signature: a smooth, stair-stepping blue line pointing steadily from bottom-left to top-right, with green vertical “icicles” hanging far below the blue line every few weeks before snapping back up when price finally retraces and closes the basket.
- Numeric proof in the summary block: compare Balance Drawdown Relative against Equity Drawdown Relative (covered in full in absolute vs relative drawdown in MT5). On a disciplined single-order EA with tight hard stops — such as Ghost Scalper MT5 (
14.57%balance DD vs14.93%equity DD) — the two numbers sit within a percentage point or two of each other. On a true grid like Icarus Grid Bias MT5, balance drawdown prints a mild16.08%while equity drawdown hits50.81%— more than three times deeper.
Whenever a seller crops their screenshot to hide the green line or quotes only Balance Drawdown (or worse, Absolute Drawdown = 0.00), treat the EA as an unhedged averaging system until the raw report proves otherwise.
Sign 2: Overlapping Entries and Simultaneous Basket Exits in Deals
Clever grid authors sometimes close losing first legs partially against winning later legs so the green icicles look smaller on a multi-year chart. To catch averaging with certainty, run the free Market demo yourself, export the HTML/XML report (see how to read an MT5 Strategy Tester report), and scroll straight down to the Deals table.
Pick any equity dip on the graph, jump to that date in Deals, and check three columns — Direction (in vs out), Volume, and Price:
Time                 Deal    Type   Dir   Volume   Price     S / L   T / P   Profit    Comment
2026.08.14 09:15:00  1041    buy    in    0.01     2460.00   0.00    0.00     0.00     lvl_1
2026.08.14 10:40:12  1042    buy    in    0.02     2452.00   0.00    0.00     0.00     lvl_2
2026.08.14 13:05:44  1043    buy    in    0.03     2444.00   0.00    0.00     0.00     lvl_3
2026.08.14 16:22:09  1044    sell   out   0.01     2450.80                   -9.20     basket_tp
2026.08.14 16:22:09  1045    sell   out   0.02     2450.80                   -2.40     basket_tp
2026.08.14 16:22:09  1046    sell   out   0.03     2450.80                  +20.40     basket_tp
Three forensic giveaways in that six-line sequence prove an averaging grid plus lot progression beyond any marketing spin:
- Consecutive
indeals into worse prices: threebuy inentries fire at2460.00,2452.00, and2444.00while the previous buys are still underwater, with0.00in theS / Lcolumn (or a cosmetic stop 5,000 points away). - Ascending basket volume: lot size steps
0.01 → 0.02 → 0.03(additive progression) or0.01 → 0.02 → 0.04(geometric martingale) so a partial bounce back to2450.80offsets the losses on legs 1 and 2. - Identical
outtimestamps across all open tickets: deals1044,1045, and1046all close inside the exact same second (16:22:09) at2450.80— where the earliest trade actually closed at a-$9.20loss subsidized by the0.03-lot rescue leg’s+$20.40gain.
Sign 3: Post-Loss Lot Jumps (Sequential Martingale Without a Grid)
An EA can pass Sign 1 and Sign 2 — holding strictly one position at a time with a genuine broker-side stop-loss — and still run a martingale recovery ladder between sequential trades. Instead of adding to an open loser, it waits for the stop-loss to hit, then opens the next signal at 1.5× or 2.0× the previous lot size.
Check two places to catch sequential recovery:
- Inspect the preset inputs first: open the
.setfile or Inputs grid (using the workflow in how to load and audit MT5 .set files in Strategy Tester) and search for keywords such asRecovery,Multiplier,Martingale,LossFactor,Step, orBooster. Even when a default preset leaves recovery disabled — as we found in Scalping Robot Pro MT5, where a1.89recovery multiplier sat switchedOffby default — knowing the switch exists prevents a vendor’s “aggressive”.setfile from surprising you. - Check volume right after a closed loss in
Deals: under standard fixed-fractional compounding (say,1%of balance per trade), a closed loss slightly reduces account balance, so the very next trade’s lot size either stays flat or ticks slightly down (assuming similar stop distance). If closed losses at0.02lots are immediately followed by new entries at0.04,0.07, and0.12lots while account balance is falling, post-loss recovery is active.
Sign 4: Statistical Fingerprints in the Summary Block
Even before scrolling to Deals, four combinations in the Strategy Tester summary table should immediately raise your eyebrows:
- Win rate above
80–90%paired with Average Loss3×to10×larger than Average Win: classic payoff skew of basket-closing grids or wide-stop scalpers where rare surviving losers wipe out dozens of tiny winners. - Huge spread between Minimum and Maximum Holding Time: when Average position holding time reads
18 minuteswhile Maximum position holding time reads412 hours(17 days), winners close fast while trapped baskets sit open for weeks accumulating swap until price finally comes back. - Strongly negative Z-Score (for example, below
-3.0): in our 15M Gold Scalper run with its loss-recovery ladder enabled, the report printedZ-Score = -5.17 (99.74%), reflecting strong streak dependency in trade outcomes. - Zero
SLexits despite a “Hard Stop-Loss” claim: check the Order/Deal comments in the report (slvstpvs custom EA close comments). Many EAs attach an emergency “catastrophe stop” 3,000 points away solely to satisfy MQL5 Market copywriting while closing 99.9% of positions internally via grid basket logic.
What Is NOT a Grid or Martingale: Avoiding Common False Alarms
Rigorous auditing cuts both ways — do not accuse an EA of martingale when the Deals log actually shows standard compounding or independent multi-strategy execution:
- Growing lot sizes over a multi-year run: in Lizard EA MT5 (
Highpreset,1%risk) lots grew from0.01on$1,000to0.17as closed balance compounded above$17,000, and in Gold Beaver MT5 (Run B) floating sizing scaled from0.01to0.31as balance rose. That is proportional balance compounding: check what happens after a losing streak, not between Year 1 and Year 3. - Variable lots driven by dynamic stop distance: an EA sizing
1%risk against a swing-low stop will open0.10lots when the stop is$10away and0.05lots when the stop is$20away. Both trades risk the exact same$100on stop-out. - Multiple independent magic numbers trading simultaneously: Ghost Scalper MT5 held up to five concurrent positions across four sub-strategies (
Ghost AthroughGhost D), yet every single one of its9,934deals traded at0.01lots with an independent stop-loss. Shared symbol exposure still requires margin planning, but it is structurally different from averaging into a losing position without stops.
Where to Go Next
- New to navigating MT5’s HTML report blocks? Start with how to read an MT5 Strategy Tester report, line by line.
- Need the exact math behind MT5’s six Balance and Equity drawdown cells? Read absolute vs relative drawdown in MT5: the number that actually matters.
- Want to inspect vendor presets for hidden recovery multipliers before running a test? Check how to load, save, and audit .set files in MT5 Strategy Tester, or see these exact checks applied to real commercial bots in our Test Reports.
FAQ
Is every grid or recovery Expert Advisor automatically unusable?
No — open-eyed traders sometimes run capped grids on small, segregated cent accounts where the entire account deposit represents their defined maximum risk, withdrawing profits periodically. What destroys accounts is running an unrecognized grid or uncapped recovery ladder on main capital or a prop-firm evaluation while believing every trade risks a fixed 1%.
Can I spot hidden martingale on an MQL5 Market EA without buying it?
Yes. Download the free Strategy Tester demo directly inside MetaTrader 5, run it over a multi-year window that includes major directional trends (such as 2022–2026 on XAUUSD or EURUSD), right-click the Backtest tab to export the full Report → HTML, and inspect the green equity line plus the raw Deals table.
Why do some grid EAs pass a one-year backtest with zero blown baskets?
Because grid spacing and lot caps are trivially tuned in hindsight to survive the exact maximum adverse excursion of the last twelve months. Run the exact same .set file over five to six years (or widen grid stress on an out-of-sample symbol) and you will see what happens when a trend exceeds the tuned basket depth.
Does setting a broker-side Stop-Loss on every order prove there is no grid?
Not by itself. Many grid EAs stamp a wide 2,500-to-5,000-point catastrophic stop onto each leg so every order technically carries a non-zero S / L value, while stacking six or ten averaging entries well inside that distance. Always check concurrent open positions and in entry spacing in Deals.
How does a prop-firm daily drawdown rule interact with grid EAs?
Most prop evaluations enforce a 4–5% daily loss limit calculated from floating equity relative to the day’s starting balance or high-water mark. Because averaging grids routinely dip 15–50% in floating equity before closing a basket in profit, they frequently breach prop daily equity limits on days where closed balance never lost a dollar.
Risk & Transparency Notice: All indicators, scripts, and backtest results on AlgoToolbox are for educational and testing purposes only. Trading Forex, CFDs, and cryptocurrencies carries significant financial risk. Past performance does not guarantee future results. Read our full Risk Disclaimer.