How to Read an MT5 Strategy Tester Report, Line by Line
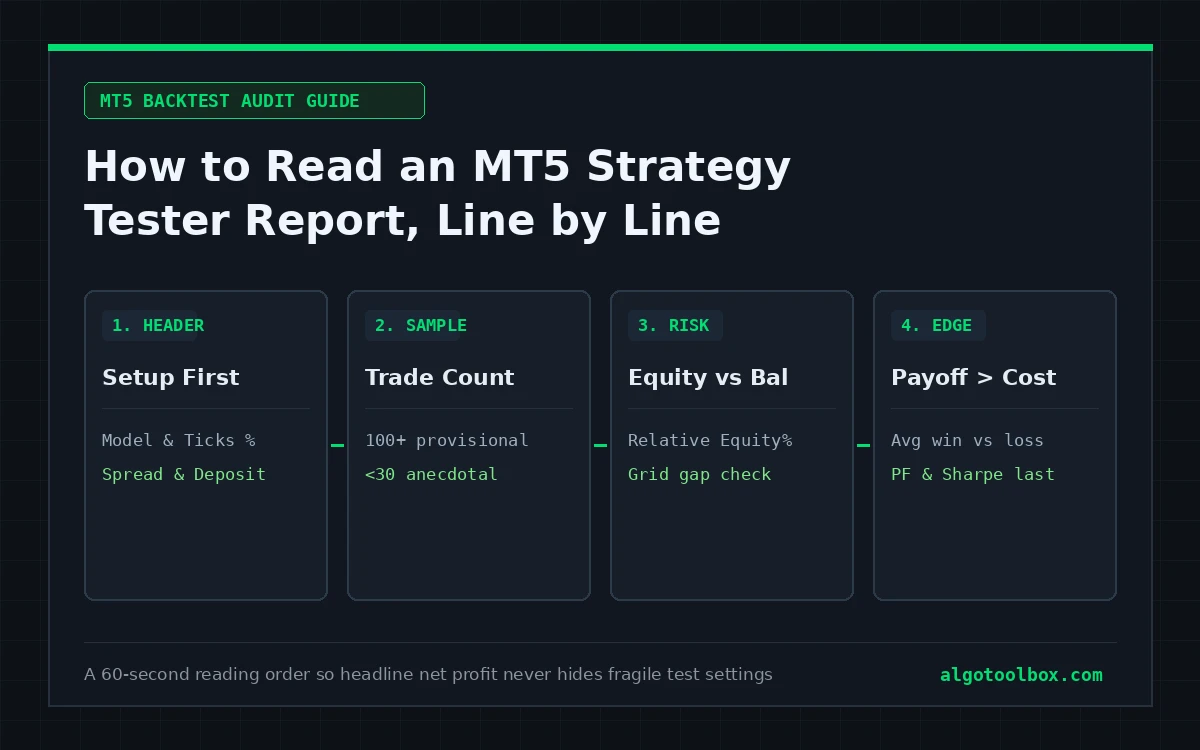
An MT5 backtest printout is a mechanical log of what a simulation did under the settings you typed in. Learning how to read MT5 strategy tester report numbers properly starts with recognizing that no single line in the file proves an Expert Advisor has a live trading edge. Every metric — net profit, profit factor, win rate, drawdown — is conditional on the data mode, spread, leverage, and sample size above it.
This guide walks through the MetaTrader 5 Strategy Tester report in the exact order it is printed, separates closed-balance metrics from floating-equity exposure, and gives you a 60-second reading order that stops a big green profit curve from hiding fragile assumptions.
First: The Header Block Decides How to Read the Numbers
Before looking at net profit or the equity curve, read the top configuration table. Every ratio further down the page is invalid if the header underneath it is unrealistic:
| Header field | Why it governs everything below it |
|---|---|
| Symbol | XAUUSD on a standard USD account is not identical to XAUUSDc on a cent account. Digits, contract size, and deposit currency change what “300 points of spread” or “10,000 profit” means. |
| Period | The chart timeframe plus the start and end dates. An M1 scalper tested over four calm months and an H1 system tested across 2020–2026 face completely different market regimes. |
| Model | Every tick based on real ticks, Every tick, 1 minute OHLC, or Open prices only. Intrabar stops and grids behave very differently on synthetic M1 OHLC ticks versus real broker ticks. |
| Spread / Latency | A typed fixed spread or zero-latency execution is an optimistic baseline assumption, never a live-cost stress test. |
| Initial Deposit & Leverage | $1,000 at 1:500 and $1,000 at 1:30 are different margin worlds; high leverage lets a grid stack positions that a lower-leverage account would have margin-called early. |
| Inputs | The exact parameter list used for the pass. Any screenshot or HTML report with its Inputs stripped cannot be reproduced on your terminal. |
| Company / Server | Tick archives, rollover swaps, and symbol specifications belong to a specific broker server (for instance Exness-MT5Real7). |
| History Quality | The share of the test window backed by real server ticks rather than generated M1 ticks. Low percentages turn intrabar scalper results into rough simulations. |
Most third-party EA tests published on AlgoToolbox run on Exness Raw Spread (MT5Real7), XAUUSD, single-pass with optimization disabled and zero latency explicitly disclosed. Keeping that header visible is what makes two runs on the same server comparable — and explains why you should never compare raw numbers across mismatched servers and deposit units.
The Results Block, Field by Field
Total Net Profit
Gross Profit minus Gross Loss, including only the commissions and overnight swaps actually modelled during the pass. If an EA trades a raw-spread symbol dozens of times a week and commission was left at 0.00, the printed net profit is overstated before you read another line.
Profit Factor
Gross Profit ÷ |Gross Loss|, where 1.00 is breakeven. Profit factor is the most advertised number on EA sales pages and one of the easiest to distort, because it contains zero information about trade count or open-position drawdown. A profit factor of 6.50 across 12 closed trades describes a dozen trades, not a durable edge.
Expected Payoff
Total Net Profit ÷ Total Trades — your average net return per closed trade in deposit currency. Expected payoff is far more practical than profit factor because you can compare it directly against realistic round-turn friction: if an M1 scalper shows an expected payoff of $0.80 per 0.01 lot under zero slippage, one extra point of live gold spread plus commission can wipe out most of that margin.
Recovery Factor
Total Net Profit ÷ Maximal Drawdown. It measures how much cumulative return the run earned per unit of worst peak-to-trough currency pain. Treat extraordinary recovery factors on short 2-to-4-month windows with scepticism — a short window simply may not have encountered an adverse trend yet.
Sharpe Ratio
Return relative to return volatility as sampled by the tester. Useful as a secondary tie-breaker on multi-year single-lot tests, noisy on short windows, and blind to rare tail blow-ups hidden inside open grid baskets.
Drawdown: Two Curves and Three Measurements
Readers routinely collapse MT5’s drawdown output into a single “Max DD” number, missing how MetaTrader 5 actually prints it. Every report outputs six drawdown cells — three for Balance (closed trades only) and three for Equity (real-time account value including floating open losses):
- Absolute Drawdown: how far Balance or Equity dipped below your starting deposit (
Initial Deposit − Minimum). If a$1,000account climbs to$4,000and then loses$2,500down to$1,500, Absolute Drawdown still prints0.00. - Maximal Drawdown: the largest peak-to-trough drop measured in deposit currency, with the percentage at that peak shown in parentheses.
- Relative Drawdown: the largest peak-to-trough drop measured as a percentage, with its currency equivalent in parentheses.
The comparison that exposes hidden risk immediately: put Balance Drawdown Relative next to Equity Drawdown Relative. Balance updates only when deals close; Equity updates on every tick. In our Icarus Grid Bias MT5 run, relative balance drawdown was 16.08% while relative equity drawdown hit 50.81%. Whenever equity drawdown towers over balance drawdown, the EA is holding or stacking losing positions rather than cutting them.
The Trades Block: Sample Size Before Ratios
| Trades field | What to check before trusting the summary |
|---|---|
| Total Trades | Below ~100 trades, treat performance ratios as provisional; below ~30 trades, you are looking at an anecdote rather than a statistical sample. |
| Short Trades / Long Trades (won %) | Lopsided volume or win rate on one side (for example 95% buys on gold during a bull run) warns that a single macro trend carried the test. |
| Profit Trades / Loss Trades (% of total) | Win rate means nothing in isolation. A 90% win rate paired with an average loss 12× the average win only needs two bad clusters to erase months of gains, as seen on the Aggressive set in My AI Gold MT5. |
| Largest Profit Trade / Largest Loss Trade | Subtract Largest Profit Trade from Total Net Profit mentally; if half your profit came from one outlier spike, the rest of the run barely broke even. |
| Average Profit Trade / Average Loss Trade | Compare the average loss-to-win ratio directly against win rate to see whether one normal stop wipes out ten typical winners. |
| Maximal Consecutive Losses (and Loss in money) | Your worst losing streak inside the sample — check both the count and the currency hit to judge whether you would have turned the EA off mid-drawdown. |
The Three Fields Almost Everyone Skips
- History Quality vs Requested Model: Choosing Every tick based on real ticks in the dropdown is a request, not proof that real ticks existed. In Scalping Robot Pro MT5, that mode was requested, yet the tester Journal discarded all 144,033 minutes of mismatched data and fell back to generated ticks; in Gold Beaver MT5, M1 OHLC runs printed
0%History Quality on synthetic ticks. - Bars and Ticks counts: Compare the printed tick count against the timeframe and date span. Our four-month real-tick run on 15M Gold Scalper processed
27,784,252ticks across8,054M15 bars; a multi-year report showing only a few hundred thousand ticks ran on coarse synthetic interpolation. - Single pass vs Optimization survivor: An exported pass selected after a 2,000-pass genetic optimization is the best curve fitted to historical noise, not an out-of-sample test. Every baseline review on AlgoToolbox runs with optimization disabled for that reason.
A 60-Second Reading Order
When someone sends you an MT5 HTML report or screenshot, read it in this order so the headline profit never anchors your judgement first:
- Header block: symbol/unit, dates, modelling mode, History Quality, tick count, spread, deposit, and leverage.
- Total Trades: confirm whether the sample size is large enough to evaluate at all.
- Equity Drawdown Relative vs Balance Drawdown Relative: check immediately whether floating losses are hidden in open grids or averaging baskets.
- Expected Payoff vs realistic spread + commission: verify the per-trade edge exceeds live transaction friction.
- Largest Profit Trade & Average Loss vs Average Win: check for single-trade luck or inverted risk-reward fragility.
- Equity curve shape & flat stretches: look for multi-month stagnation (such as the nine-month flat period documented in Ghost Scalper MT5) that summary ratios never show.
- Profit Factor and Sharpe Ratio last: useful shorthand only after steps 1–6 pass.
What the Report Cannot Tell You
- Live spread spikes at rollover and high-impact news: unless variable real-tick spreads covered those exact minutes, fixed-spread runs miss spread expansion completely.
- Order-book slippage and stop-order fills: fast gold or FX spikes fill market and stop orders worse than quoted tick prices in ways historical tick files cannot faithfully replay.
- Network latency, requotes, and broker execution rules: zero-latency tester fills never experience order queue delays or freeze-level rejections.
- Silent look-ahead or history tuning by the vendor: even without running MT5’s optimizer yourself, an EA’s hardcoded defaults or neural weights may have been trained over the exact historical years you just tested.
Where to Go Next
- How We Test — how our five-criterion scoring rubric uses these exact report fields on third-party EAs
- Lizard EA MT5 Test Report — see how a 15% vs 70% real-tick History Quality split looks inside an actual multi-year report
- Icarus Grid Bias MT5 — worked example of
16.08%balance drawdown vs50.81%equity drawdown on a grid EA - All MT5 Test Reports — published backtest reports, including low-scoring and failed runs
FAQ
What is considered a good Profit Factor when you read MT5 strategy tester report files?
There is no universal cutoff because Profit Factor ignores trade count, transaction costs, and floating equity drawdown. A Profit Factor of 1.45 across 600 trades with real ticks, variable spreads, commission, and tight equity drawdown is far stronger evidence than 5.00 across 18 trades on synthetic OHLC data.
Why is Equity Drawdown much higher than Balance Drawdown in my MT5 report?
Balance only records closed deals, whereas Equity tracks open floating losses on every tick. A wide gap means the Expert Advisor holds losing trades open — or adds averaging/grid lots — waiting for price to bounce before closing.
How many trades should an MT5 backtest have before its ratios mean anything?
Treat anything under roughly 100 trades as provisional and anything under 30 trades as anecdotal, regardless of how smooth the balance curve looks. Also verify that those trades span more than one market regime rather than a single one-way rally.
Does selecting “Every tick based on real ticks” mean my report used 100% real ticks?
Not necessarily. That dropdown is a request to the terminal; if your broker server lacks tick archives for part of the date window (or the tester discards mismatched minutes), MT5 substitutes generated ticks and logs the shortfall in History Quality and the Journal tab.
Why does an MT5 report show Absolute Drawdown as 0.00 when the chart clearly had big drops?
Because Absolute Drawdown in MetaTrader 5 measures only how far the account fell below your starting initial deposit. Once early profits push the account well above its initial deposit, subsequent drops that stay above the starting line register under Maximal and Relative Drawdown while Absolute Drawdown stays at zero.
⚠️ Risk & Transparency Notice: All indicators, scripts, and backtest results on AlgoToolbox are for educational and testing purposes only. Trading Forex, CFDs, and cryptocurrencies carries significant financial risk. Past performance does not guarantee future results. This article may contain contextual affiliate links to tools or brokers we use. Read our full Risk Disclaimer.