Ghost Scalper MT5 Review
Ghost Scalper MT5 v5.0 backtested on XAUUSD H1 for 34 months: PF 1.63, 14.93% drawdown, no martingale, but a nine-month flat stretch.
This Ghost Scalper MT5 review takes Thomas Christoph Lipka’s $499 gold Expert Advisor through a 34-month Strategy Tester run. The EA trades XAUUSD on the H1 chart with four breakout and momentum strategies, Ghost A to D. Each one places pending stop orders and manages the position with a stop-loss, a take-profit and a trailing stop.
We tested version 5.0 from the Market demo on a raw-spread trial server, at a fixed 0.01 lot per strategy, from January 2024 to October 2026. The run ended with a 1.63 profit factor and a 14.93% maximum equity drawdown. However, the whole window predates the release we tested, and nine of those months went nowhere.
Test Bench
| Specification | Our configuration |
|---|---|
| Platform | MetaTrader 5 |
| Tool type | Expert Advisor |
| Version tested | 5.0 |
| Symbol / timeframe | XAUUSD H1 |
| Test period | 2024.01.01 – 2026.10.21 |
| Data / tick mode | Every tick based on real ticks (history quality 28% real ticks) |
| Account & spread | Exness Raw Spread trial, variable spread, $0.04 commission per 0.01 lot, $1,000 deposit, 1:500 |
| Copy tested | Free demo (MQL5 Market), Strategy Tester |
What Ghost Scalper MT5 Is and What the Listing Promises
Ghost Scalper MT5 is a fully automated Expert Advisor for gold. According to the official MQL5 Market listing, it runs four independent strategies, Ghost A, B, C and D. Each one can be switched on or off, its buy and sell sides can be enabled separately, and each has its own money management: Fixed Lot, Risk Percent or Risk per Balance. The recommended setup is XAUUSD on H1, with Trailing Mode STANDARD and Slippage Calculation MEDIUM.
The listing adds several features we could not fully test in the tester. First, an “Adaptive Anti-Slippage” layer adjusts the stop-loss, take-profit and trailing behavior by 25%, 50% or 100% of the slippage the broker actually delivers. The listing itself says that this layer cannot remove slippage completely, and that real broker slippage cannot be reliably simulated in the MT5 Strategy Tester. Second, a news filter covers FOMC, CPI, NFP and PCE, with a 30-minute window on each side. Third, the listing links three public signal accounts and warns that long stretches without trades are normal.
On 25 October 2026 the listing price was $499, or $299 for a one-month rental. The product was published on 10 August 2026 and has received 17 updates since, the latest being version 5.10 on 25 October 2026, which adds prop-firm protection. We tested version 5.0, released on 13 October 2026; its changelog mentions “improved entry and trailing with self-learning technology”. The trailing logic changed several times between those releases. Results from one version may therefore not carry over to the next.
How It Trades in the Tester
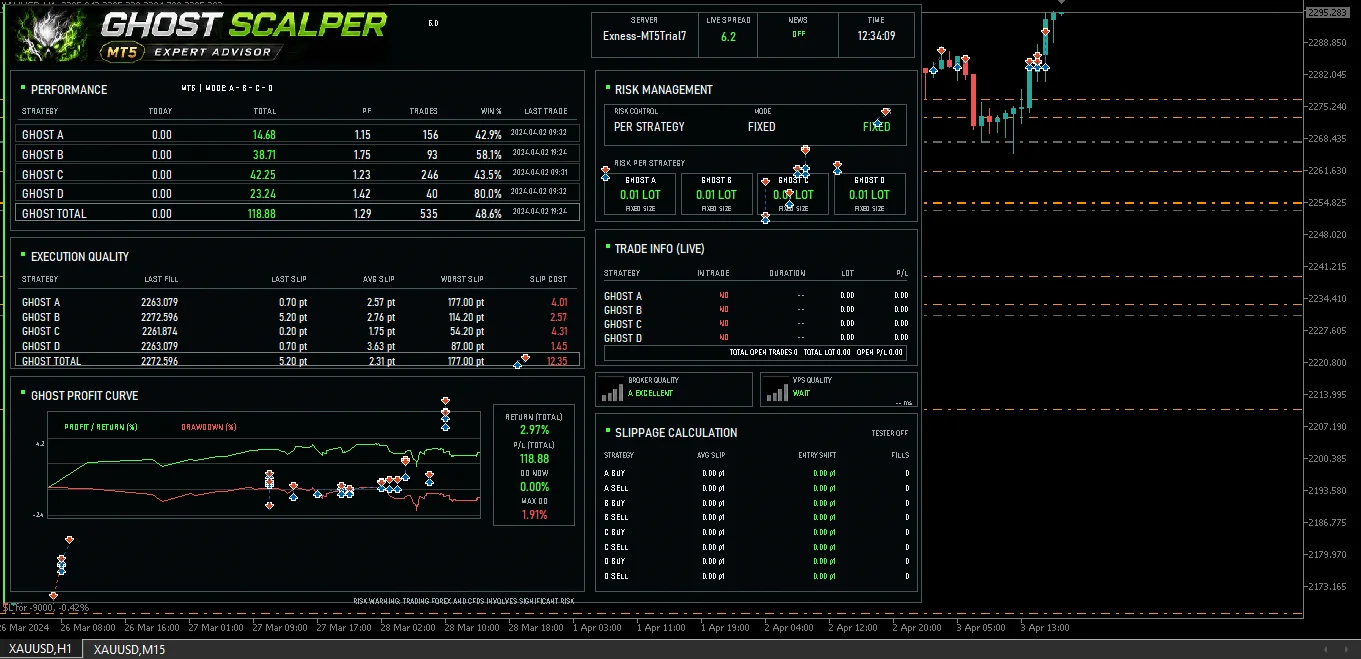
We have no source code for this EA, so this section describes what it did in the Strategy Tester and what the deal list records. Version 5.0 never needed manual input during the run. Over the 34 months it opened 4,967 positions: 2,293 from Ghost C, 1,291 from Ghost A, 1,010 from Ghost B and 373 from Ghost D.
Entry
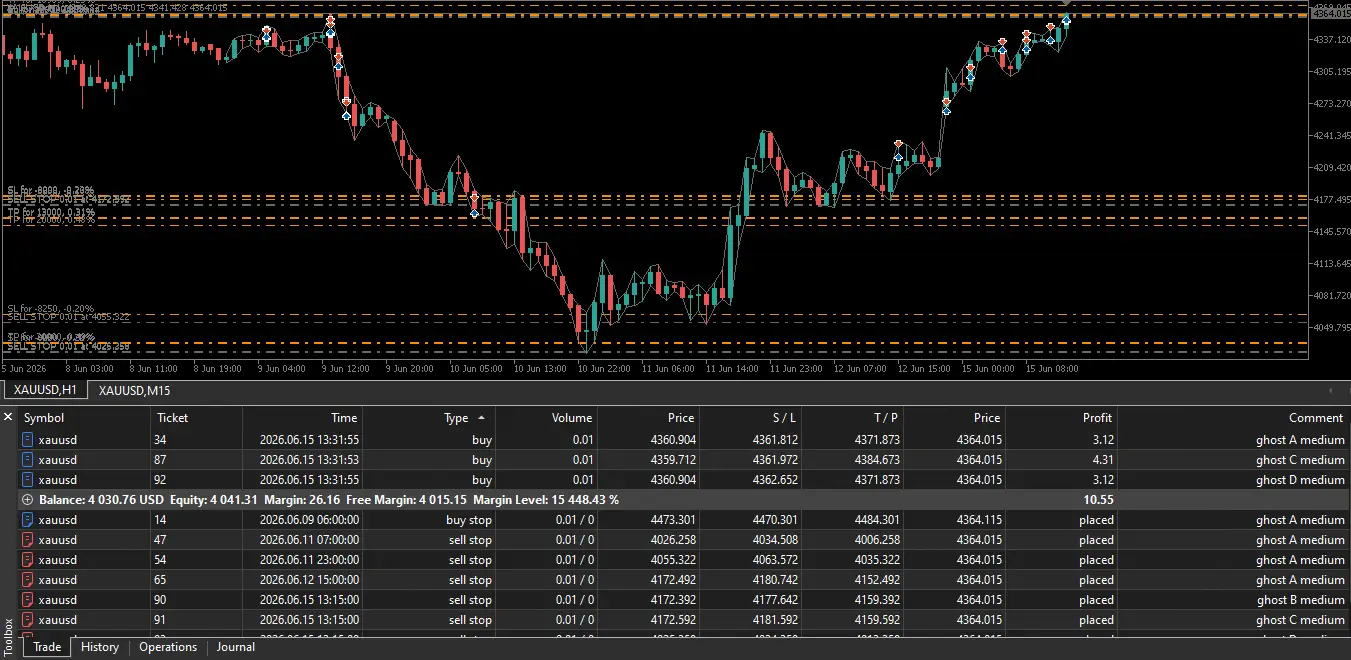
Entries come from pending stop orders. In our visual run (Figure 2) the EA keeps buy stops above price and sell stops below it, each labeled with its strategy and slippage level, for example “ghost A medium”. Every pending order already carries a stop-loss and a take-profit when it is placed. The distances we read in that capture range from 300 to 900 points for the stop-loss and from 1,100 to 2,000 points for the take-profit. Older orders stay on the chart for days, so several strategies can be armed on the same side at once.
Exit
Most trades are closed by the trailing stop, not by the take-profit. In the deal list, 4,851 of 4,967 exits carry the broker’s “sl” tag, while only 65 reached the take-profit. Because 2,664 trades closed in profit, most of those stop-outs were stops that had already trailed past the entry price. Figure 2 shows exactly that: three long positions from Ghost A, C and D, each with its stop-loss moved above the entry. The remaining exits were 49 closes by the EA itself and two positions closed at the end of the test.
Position management
We saw no grid and no martingale. Every one of the 9,934 deals in the report is 0.01 lots, so the EA never increased size after a loss and never added to a losing position. However, the four strategies do overlap: up to five positions were open at the same time (on 29 January 2024), and Figure 2 shows three longs opened within seconds of each other at almost the same price. Positions stayed open for 27 minutes on average, but the longest lasted 32.5 hours.
Our Test Setup
| Input | Default | Our value | Why |
|---|---|---|---|
| Ghost A, B, C, D | Each can be switched on or off | All four on, buy and sell | Test the complete package as sold |
| Lot mode (each strategy) | Fixed Lot, Risk Percent or Risk per Balance | Fixed lot 0.01 | Equal-size trades show the strategy without compounding |
| Trailing / exit mode | STANDARD (listing) | STANDARD | The developer’s recommended mode, with internal SL, TP and trailing values |
| Slippage calculation | MEDIUM (listing) | MEDIUM on all four | Recommended setting; the tester does not reproduce broker slippage anyway |
| News filter | Optional | Off | It needs WebRequest, which does not run in the Strategy Tester |
| Dashboard mode | BIG, SMALL or OFF | 2 | Display only; it has no effect on trading |
Disclosure: the broker link below is an affiliate link; AlgoToolbox may earn a commission at no cost to you. It does not affect our test results.
The run used the Exness-MT5Trial7 server (terminal build 6230) on an Exness raw-spread trial account. Settings were a $1,000 deposit, 1:500 leverage, XAUUSD H1, and the period 1 January 2024 to 21 October 2026, with visual mode off. We chose “Every tick based on real ticks”, but the report shows a history quality of only 28% real ticks: the rest was filled with generated ticks. Spread came from the server’s history, and commission was charged at $0.04 per 0.01-lot trade. The full bench rules are on our how we test page.
Backtest Results: Reading the Data
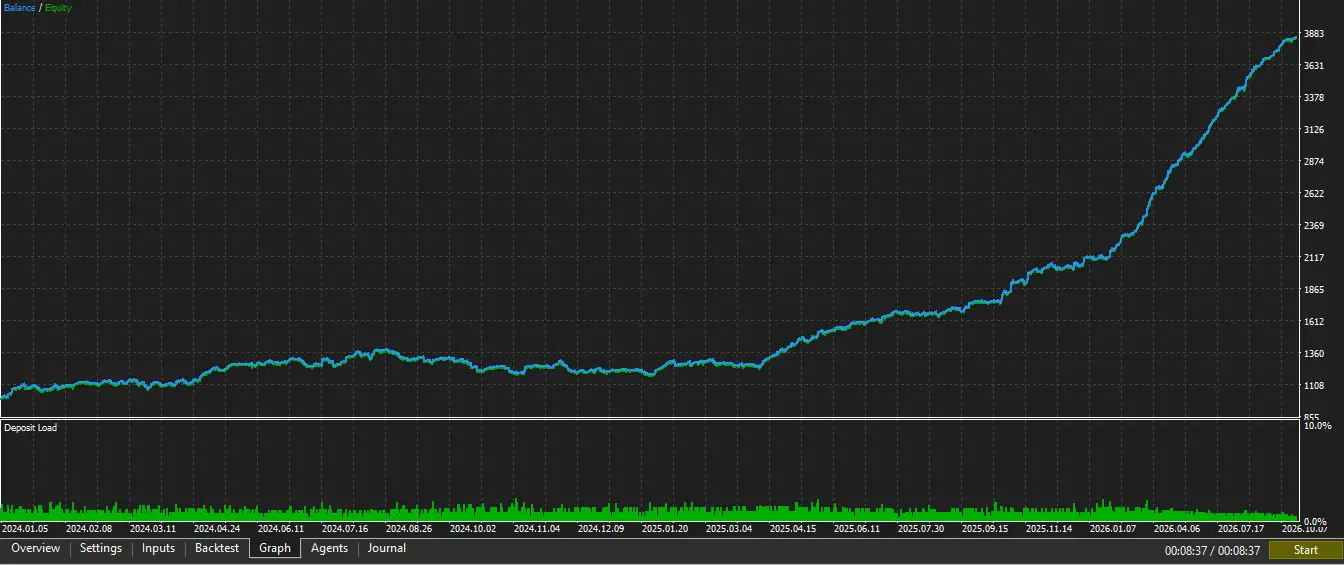
The equity curve has three phases. From January to July 2024 the account grew steadily to about $1,388. It then stalled for nine months: from July 2024 to March 2025 the EA lost $56.41 across 1,544 trades, a profit factor of 1.02. The balance did not make a new high for 245 days, from 23 August 2024 to 25 April 2025. From April 2025 onward the curve climbs with almost no setbacks, and it gets steeper through 2026.
The drawdown was shallow relative to the profit. The deepest balance drawdown was 14.53% ($201.75), from the August 2024 peak to a low on 21 January 2025. Only five of the 34 months lost money, all between March 2024 and March 2025, and the worst was October 2024 at −$99.50. The deposit-load panel under Figure 3 stays in the low single digits throughout, which is expected for 0.01 lots on $1,000.
| Metric | Result | Source | What It Tells You |
|---|---|---|---|
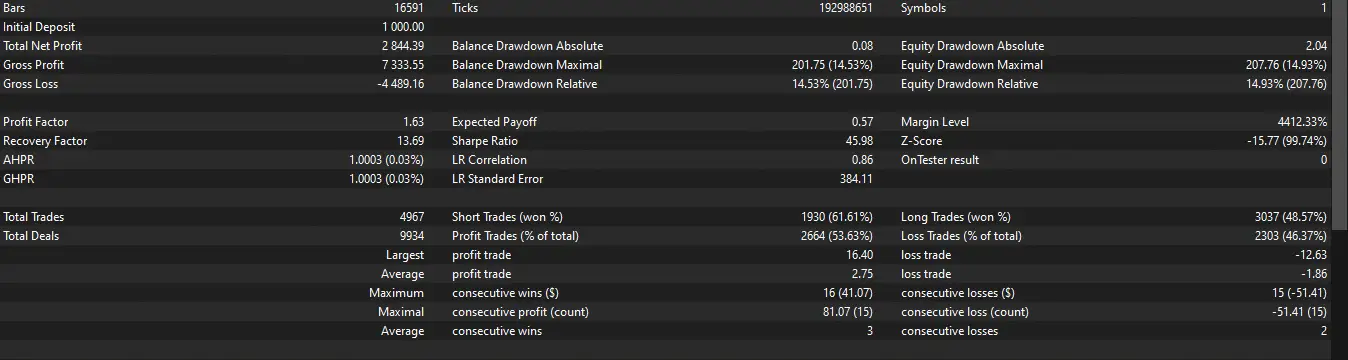
| Total net profit | $2,844.39 on $1,000 | Run 1 report (Figure 4) | A 284% gain at a fixed 0.01 lot per strategy, with no compounding |
| Profit factor | 1.63 | Run 1 report (Figure 4) | Gross profit of $7,333.55 against a gross loss of $4,489.16 |
| Trades and win rate | 4,967 trades, 53.63% won | Run 1 report (Figure 4) | About 34 trades a week; shorts won 61.61% of the time, longs 48.57% |
| Max equity drawdown | 14.93% ($207.76) | Run 1 report (Figure 4) | Floating losses barely went deeper than closed ones |
| Average win / loss | $2.75 / −$1.86 | Run 1 report (Figure 4) | Winners are larger than losers, so the edge does not rely on the win rate |
| Worst losing streak | 15 trades, −$51.41 | Run 1 report (Figure 4) | Long streaks of small losses are normal for this exit style |
| Trading costs | $198.68 commission, $43.61 swap | Run 1 deal list | Costs took about 8% of gross profit; the average trade earned $0.57 after them |
| Holding time | 27 min average, 32.5 h maximum | Run 1 report | Mostly short trades, but some are held overnight |
What One Run Can and Cannot Show
We completed one run, so the following split comes from that run’s deal list, not from separate tests. Specifically, 2024 made $225.38 with a profit factor of 1.18. In 2025 the figures were $892.56 and 1.60, and in 2026 up to 21 October they were $1,726.45 and 3.44. The edge therefore grows the closer the data gets to the release date. Since the listing went live on 10 August 2026, the run made $418.01 on 319 trades with a 3.53 profit factor.
There are two ways to read that trend. First, gold moved from roughly $2,000 to above $5,500 in this data, so a fixed 0.01 lot earns more dollars per move in 2026; the average winning trade rose from $2.23 in 2024 to $3.37 in 2026. Second, version 5.0 came out on 13 October 2026, so nearly the entire window was available to the developer before release. Only the last 47 trades in our run happened after that date, which is far too few to judge. We did not run a second period, a spread stress test or the 5.10 update.
Listing Claims vs Our Results
| Claim (listing) | What we measured | Match? |
|---|---|---|
| Fully automated EA for XAUUSD, recommended on H1 | Ran unattended on XAUUSD H1 for 34 months, 4,967 trades | ✅ matches |
| Four independent strategies, A to D | Separate tags and magic numbers; 373 to 2,293 trades per strategy | ✅ matches |
| Automatic stop-loss, take-profit and trailing stop | Every order carried SL and TP; 4,851 exits by stop, 65 by take-profit | ✅ matches |
| “Multiple strategies may trade simultaneously” | Up to five positions open at once | ✅ matches |
| Position sizing configurable per strategy | Fixed Lot honored: all 9,934 deals at 0.01; other modes not run | ⚠️ partly |
| News filter for FOMC, CPI, NFP, PCE | Requires WebRequest, which is unavailable in the tester | — not testable in a demo |
| Adaptive Anti-Slippage | Broker slippage is not simulated in the tester (the listing agrees) | — not testable in a demo |
| Public live signals show the EA’s activity | Our run: ~34 trades a week. Signals: 34–35 a week, 10–11 weeks old (25 Oct 2026) | ⚠️ partly |
Everything we could check in the tester matched the listing. The signals row is only a partial match. The trade frequency lines up, but the three accounts are 10 to 11 weeks old and run much larger positions: their pages show a maximum deposit load of 28% to 33%, against low single digits in our run. Their maximum balance drawdowns were 34.6% (VT Markets), 16.2% (Vantage) and 16.1% (Ultima Markets).
Two of those accounts also need context. The Vantage page states that its trading style changed and part of its history is excluded from the statistics. The Ultima page describes itself as a research-and-development account that tests changes for future releases. In addition, positions on the signals were held for 2 to 3 minutes on average, against 27 minutes in our backtest, which suggests live execution differs from the tester’s partly generated ticks.
Risk Profile and When It Fails
Stop orders fill at the worst moment in fast markets. A breakout EA buys strength and sells weakness through pending stops, and around NFP, CPI or a Fed decision gold can jump past those levels by hundreds of points. The tester filled our orders without broker slippage, and the news filter that might avoid those minutes could not run. Live results around news will therefore be worse than this backtest by an amount we cannot measure.
The strategies can also stack risk. All four trade the same symbol, so a sharp reversal can hit several positions at once, as Figure 2 shows with three longs opened together. Therefore, judge the total risk of all four strategies, not the per-strategy setting. Additionally, a fixed lot carries more dollar risk as gold gets more expensive: the largest single loss was $12.63, and the worst streak cost $51.41 at only 0.01 lots.
The most likely failure is a long flat stretch. Our run spent nine months without progress, and a trader paying $299 a month in rent would have paid for every one of them. On deposit size, we tested $1,000 for four strategies at 0.01 lots each. By simple arithmetic (not a separate run), 0.02 lots per strategy on the same balance would have roughly doubled the dollar drawdown to about 30%.
How It Compares
Our own 15m Gold Scalper MT5 EA also trades XAUUSD, but on M15. It takes closed-bar EMA/RSI momentum signals, places one market order per signal and uses a swing stop with a partial-profit ladder. Its optional loss-recovery ladder is the main source of its drawdown. Ghost Scalper, by contrast, never changes lot size and relies on pending breakout orders and a tight trailing stop.
The Icarus Grid Bias MT5 EA sits at the opposite end of the risk spectrum: a two-sided grid with lot progression and no fixed per-trade stop. Comparing the two shows why Ghost Scalper’s drawdown stayed near 15%: every trade had a hard exit. For more Expert Advisors with their own test notes, see our Expert Advisor list.
Installing It and Testing It Yourself
Open the developer’s official page and click Free Demo. MetaTrader 5 downloads the demo into the Market section of the Navigator. A Market demo runs only in the Strategy Tester; it cannot trade on a demo or live chart. Press Ctrl+R, select Ghost Scalper, set XAUUSD and H1, and choose “Every tick based on real ticks”. After the run, check the history-quality figure in the report, because ours was only 28%.
To repeat our test, keep STANDARD trailing and MEDIUM slippage, set a fixed 0.01 lot on all four strategies, and turn the news filter off. Then go further than we did. Test a period after the version you plan to buy was released, and add a run with a wider spread. If you then rent or buy, run it on a demo account for at least 90 days before risking live money. Keep in mind that 90 days of rental costs about $897.
Advantages and Disadvantages
Advantages
- Every order carries a broker-side stop-loss and take-profit from the moment it is placed.
- No martingale or grid: all 9,934 deals in our run were 0.01 lots.
- A 1.63 profit factor with a 14.93% maximum equity drawdown over 34 months at a fixed lot.
- Each strategy and each trade direction can be switched off separately.
- The listing openly states the tester’s limits on slippage.
Disadvantages
- The tested window predates version 5.0, so no part of it is a true out-of-sample check.
- Nine flat months (July 2024 to March 2025) and 245 days without a new high.
- Only 28% real-tick history quality for a tight trailing-stop system.
- The news filter and Anti-Slippage cannot be checked in a demo.
- 17 updates in 11 weeks; results may not carry from one version to the next.
- The signal accounts are only 10 to 11 weeks old and one is a research-and-development account.
Source, Licence and Distribution
- Rights
- Commercial product
- Developer
- Thomas Christoph Lipka
- Licence
- Commercial (MQL5 Market)
- Official price
- $499
- Version tested
- 5.0
- Tool type
- Expert Advisor
Commercial product. This report covers the trading logic and our own test results. Purchase, licensing, support and updates are handled by the developer via the official page. AlgoToolbox does not sell, host or sublicense this software.
How we tested it. We downloaded the free demo version from the developer’s official MQL5 Market page and ran it in the MetaTrader 5 Strategy Tester. Market demo versions only run in the Strategy Tester. The performance results from our own tests in this report are backtests, not live or forward trading. We did not buy a licence and did not receive a free copy or any payment from the developer. The developer did not see or approve this report before publication. We earn nothing if you buy this product. How we test and score.
Frequently Asked Questions
Does Ghost Scalper use martingale or a grid?
Not in version 5.0 as we ran it. All 9,934 deals in our 34-month report were 0.01 lots, and no position was added to after a loss. Each trade had its own stop-loss and take-profit. However, the four strategies can hold up to five positions at once in the same direction, so total exposure can still build up even without any lot multiplication.
What deposit does Ghost Scalper need?
The listing does not state a minimum deposit. We used $1,000 for four strategies at 0.01 lots each, and the maximum equity drawdown was 14.93%, about $208. Larger lots scale that dollar drawdown in proportion. The public signal accounts started with 100 to 150 euros at a deposit load near 30%, and recorded drawdowns of 16% to 35% within their first 11 weeks.
Is this Ghost Scalper MT5 review based on live trading?
No. The Market demo runs only in the MT5 Strategy Tester, so every figure we report is a backtest. The three signal accounts on the listing belong to the developer; we only quote their published statistics as of 25 October 2026. Backtests ignore real broker slippage, which the listing itself says cannot be reliably simulated.
Is Ghost Scalper a scam?
Nothing in our test points that way. The EA did what the listing describes: four strategies, stop-loss and take-profit on every order, and a trailing exit. It was profitable in a 34-month backtest. The open questions are about evidence, not conduct: a short live track record, signal accounts that are not a clean match for the retail version, and a tested history that predates the release.
Final Verdict
Ghost Scalper suits gold traders who want a stop-based breakout EA with no lot multiplication, and who are willing to run their own tests before paying. It is not for anyone who wants hands-off income or who plans to size up based on ten weeks of signal history. Our run showed real structure: stops on every order, a 1.63 profit factor and a contained drawdown. However, it also showed a nine-month flat stretch, and the most impressive months sit in the period the developer had before releasing version 5.0.
Our conclusion from this Ghost Scalper MT5 review is short. Worth testing, not a confident buy yet: profitable in our backtest, but that history predates v5.0 and includes a nine-month flat stretch. Before committing money, test a period after release with higher spreads, then run 90 days on a demo account at the lot size you would use live. Ask the developer which signal account runs the exact retail version and settings.
We score it 3.5 out of 5: results and risk control scored well, while robustness pulled it down because the whole tested history predates version 5.0. The five-criteria breakdown is in the verdict card above.
⚠️ Risk & Transparency Notice: All indicators, scripts, and backtest results on AlgoToolbox are for educational and testing purposes only. Trading Forex, CFDs, and cryptocurrencies carries significant financial risk. Past performance does not guarantee future results. This article may contain contextual affiliate links to tools or brokers we use. Read our full Risk Disclaimer.