Gold Beaver MT5 Review
Gold Beaver MT5 review: profitable Combo Safe OHLC runs, but history warnings, overlapping periods and stacked exposure limit confidence in the results.
This Gold Beaver MT5 review examines Arnold Bobrinskii’s XAUUSD Expert Advisor with Combo Safe and Auto protection. We tested version 5.57 on Exness Raw history with a $1,000 virtual deposit, 1:500 leverage and an M15 chart. The two main runs used the seller-recommended 1 minute OHLC modeling mode.
The primary 2026 run returned $2,311.77 at a 2.90 profit factor, but both OHLC reports flagged 0% History Quality and tick-volume errors. An extended 2025–October 2026 run also made money, while an October mixed-tick diagnostic lost. These are simulations under stated conditions, not verified live performance or an assessment of every preset.
Test Bench
| Specification | Our configuration |
|---|---|
| Platform | MetaTrader 5 |
| Tool type | Expert Advisor |
| Version tested | 5.57 |
| Symbol / timeframe | XAUUSD M15 |
| Test period | 2026.01.01 – 2026.10.31 |
| Data / tick mode | 1 minute OHLC, generated ticks; report History Quality 0% with tick-volume errors (Run A) |
| Account & spread | Exness Raw (MT5Real7), USD1,000, 1:500; zero latency; broker tester spreads, not live-cost validation |
| Copy tested | Free demo (MQL5 Market), Strategy Tester |
What Gold Beaver Is and What the Listing Promises
Gold Beaver combines several gold-trading presets in one Expert Advisor. The official MQL5 Market listing identifies Combo Safe as the starting preset and says signals are evaluated on M15 candle boundaries. It also advertises no martingale, grid or averaging, a stop-loss when a position opens, balance-scaled sizing and optional protection controls. Those are developer claims; our evidence below concerns one configuration.
The listing price was $449 when checked on October 31, 2026. We tested version 5.57 with Combo Safe, rather than selecting whichever preset ranked highest afterward. The version history also describes newly added, separate sub-minute scalper presets with execution-sensitive behavior. They are outside this report, so their requirements should not automatically be attributed to Combo Safe.

How It Trades in the Tester
Entry and position stacking
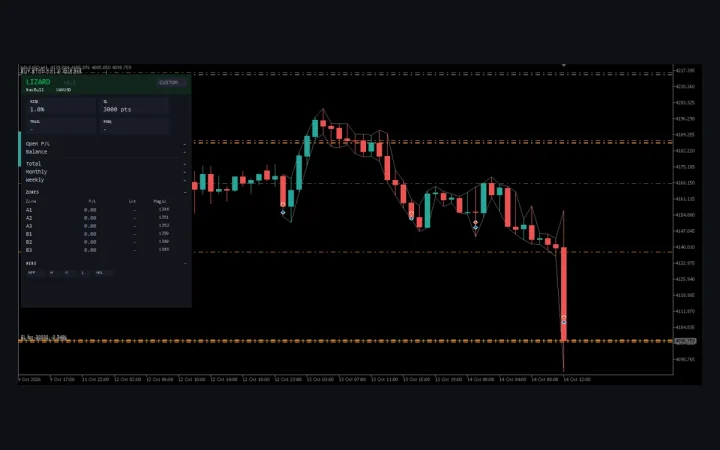
The order histories show buy-stop and sell-stop orders waiting at price levels, with multiple legs capable of opening together. The recorded entry orders in both OHLC runs carried stop-loss and take-profit values. Several positions nevertheless shared an entry time, so the headline trade counts should not be read as hundreds of wholly independent market decisions. We observed the execution records, not the proprietary signal calculations.
Exit and profit locking
Position management matters even when the entry logic uses candle boundaries. The baseline enables break-even checks on every tick. In A, 166 positions exited through a stop-loss and 55 through take-profit; in B, the split was 356 and 127. A stop-loss exit can be profitable after the stop moves beyond entry, so an SL label does not mean that every such trade lost.
Most winners by count were profit-locking stop exits: 146 of A’s 201 winners and 301 of B’s 428. However, those small wins were not the main source of net profit. A’s TP group contributed $3,112.15 after allocated costs, while its SL group lost $800.38 overall; B’s corresponding figures were $22,790.84 and minus $5,418.23. Larger target winners carried the combined result.
What the lot setting means
Fixed-lot mode was off. The input label describes floating size as balance multiplied by 11.6 and divided by 1,000,000, giving 0.0116 nominal lots at the initial $1,000 before volume normalization or preset allocation. That coefficient is not 11.6% risk per trade. Actual entries ranged from 0.01 to 0.06 lot in A and from 0.01 to 0.31 in B as the balance path developed.
Our Test Setup
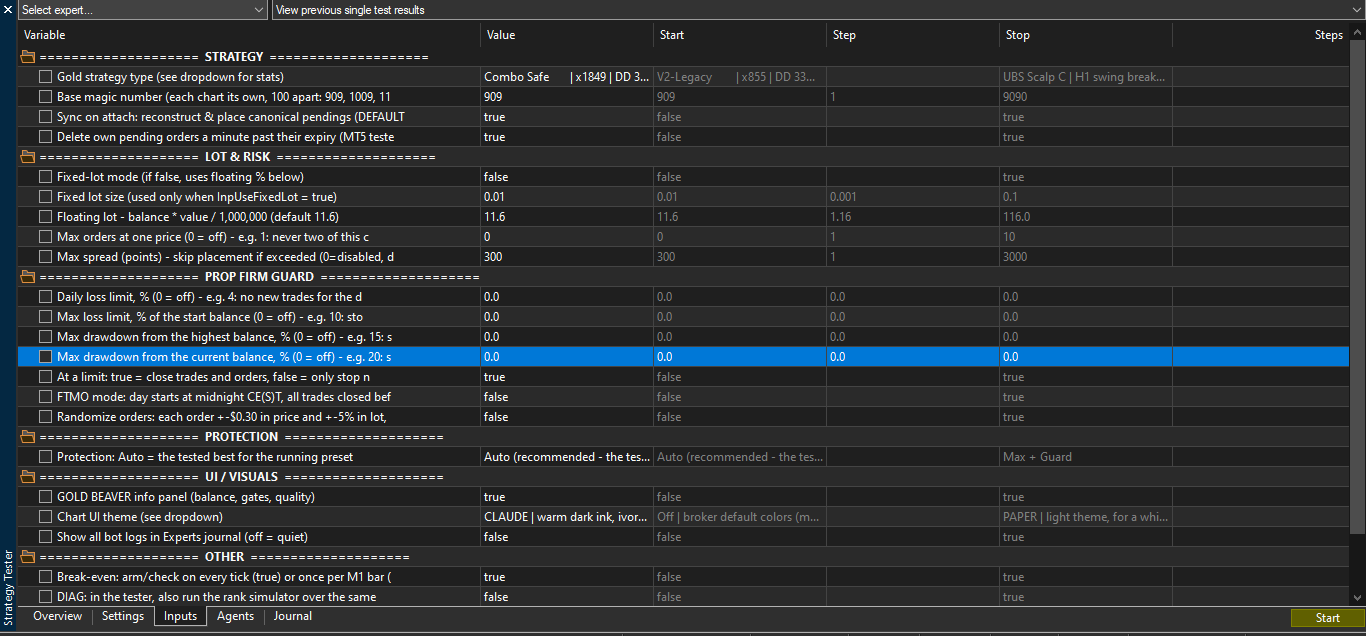
Both OHLC tests used XAUUSD on an M15 chart, with the same Exness-MT5Real7 setup and MetaTester build 6230. Each started independently at $1,000 and 1:500, with zero-latency ideal execution, optimization disabled, no forward period and visual mode off. M15 is the chart period; 1 minute OHLC is the modeling mode. The baseline below was captured before testing and left unchanged.
| Input | Captured baseline | Our value | Why it matters |
|---|---|---|---|
| Strategy | Combo Safe, Mode 15 | Unchanged; all 23 baseline inputs checked | One declared preset, not a ranking-selected winner |
| Protection | Auto, InpSmoothing 6 | Unchanged | We did not manually select a different overlay |
| Lot mode and coefficient | Fixed mode false; floating 11.6 | Unchanged | The 0.01 fixed-lot field is inactive; exposure can grow |
| Max spread | 300 broker points | Unchanged | An eligibility filter, not simulated spread stress |
| Daily/max loss and two balance-DD limits | All 0.0; close-on-limit true | Unchanged | A zero threshold remains off |
| Max orders at one price | 0, off | Unchanged | No explicit cap from this input |
| Break-even cadence | Every tick, true | Unchanged | Intrabar management still needs careful interpretation |
| FTMO/randomization/self-check | False/false/false | Unchanged | No prop-mode or preset-simulator test is claimed |
All 23 active values match across the baseline, reports and initialization logs. We left the broker’s tester cost conditions in place rather than claiming a controlled live-spread experiment. The deal totals include commission and swap, which reconcile to the final balances. Our How We Test methodology explains the distinction between stated simulation conditions, verified observations and features that remain untested.
Backtest Results: Reading the Data
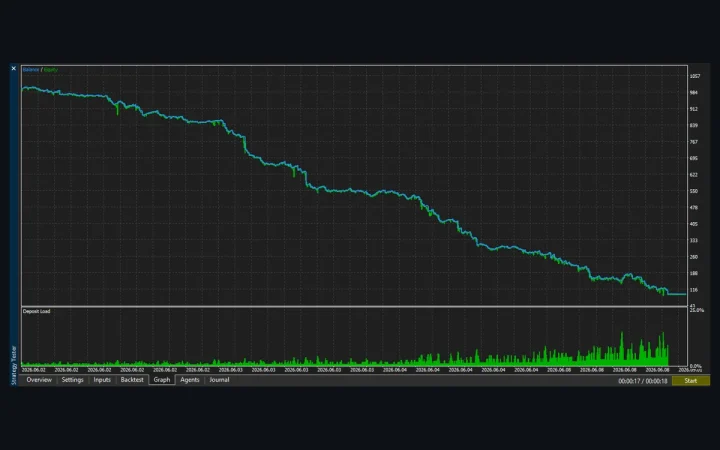
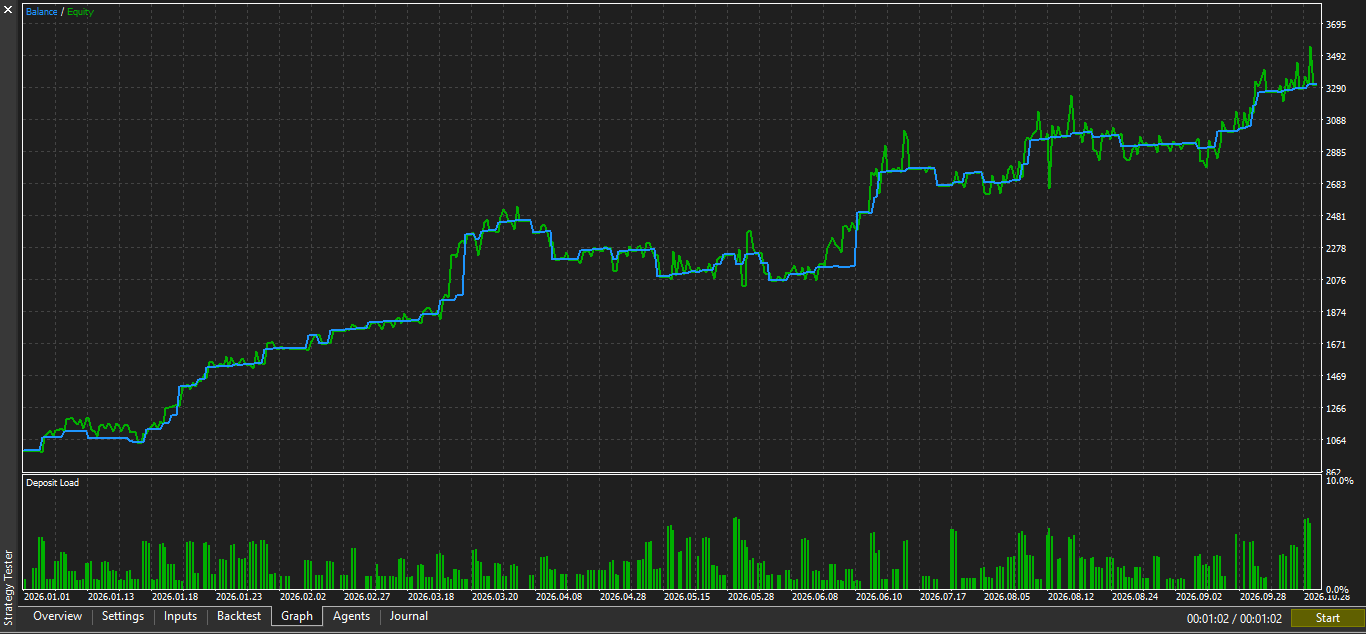
A was chosen as the primary summary run before the outcomes were examined. Its actual period is January 1–October 31, 2026, covering completed history through October 30 rather than a full calendar year. The virtual balance rose from $1,000 to $3,311.77, with a 2.90 profit factor and 19.77% maximum relative equity drawdown. Both the profitable result and the history warning belong in the same reading.
| Metric or run | Measured result | Source | What it tells you |
|---|---|---|---|
| A: January–October 2026 | Net +$2,311.77; PF 2.90; 221 trades; 90.95% wins; equity DD 19.77% | A report and Journal; Figure 3 | The primary OHLC simulation ended at $3,311.77, not a traded-account balance |
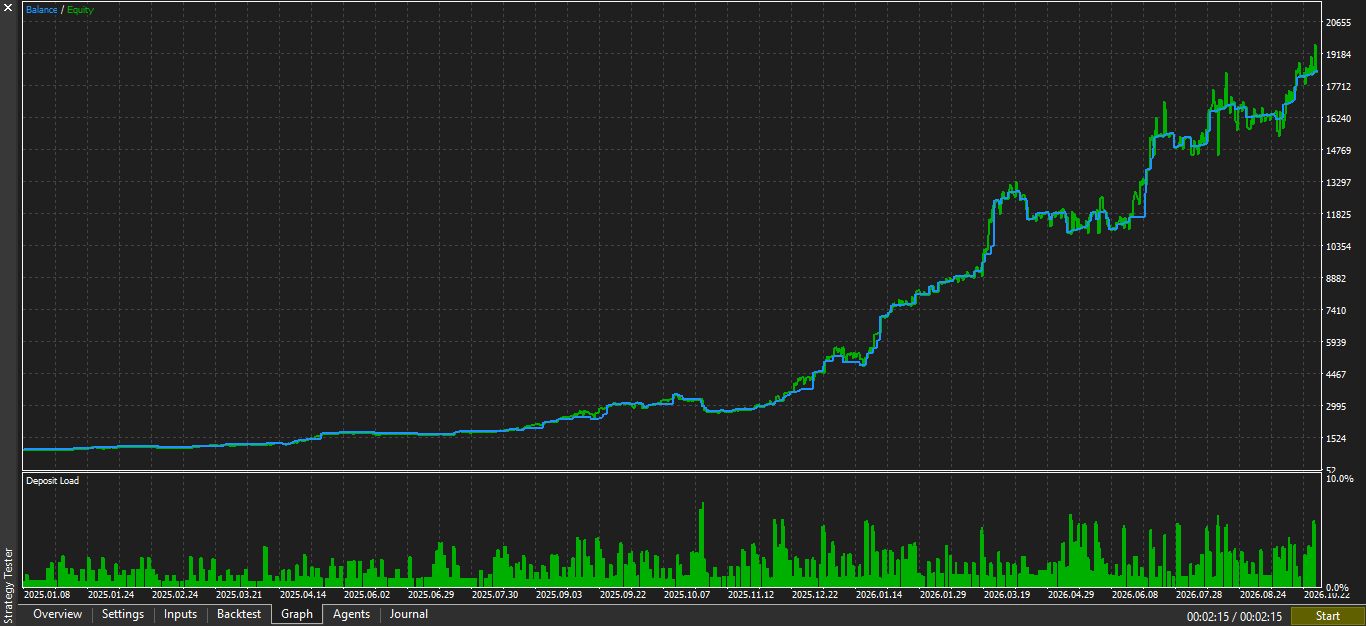
| B: January 2025–October 2026 | Net +$17,372.61; PF 3.16; 483 trades; 88.61% wins; relative equity DD 23.32% | B report and Journal; Figure 4 | Ended at $18,372.61; relative DD 23.32% ($826.30). Largest monetary equity DD $3,026.00 (17.19%) is a different event. Extended/overlapping, not 2025-only |
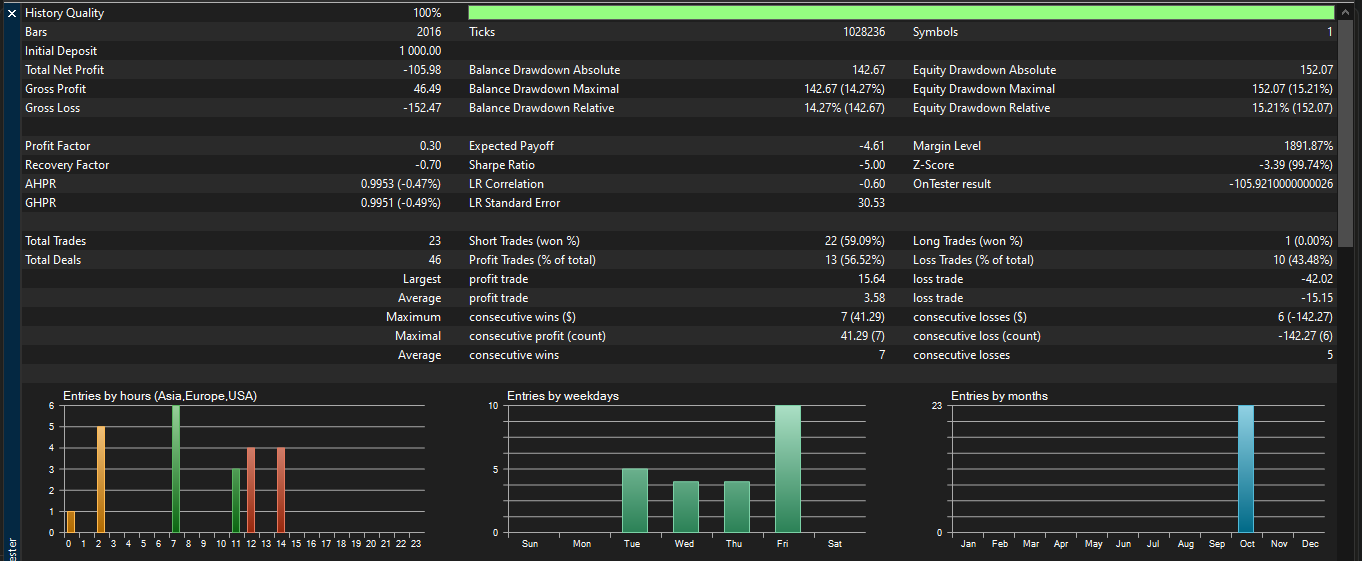
| R0: October 2026 diagnostic | Net −$105.98; PF 0.30; 23 trades; 56.52% wins; equity DD 15.21% | R0 report and Journal; Figures 5–6 | Ended at $894.02; mixed real/generated ticks, not clean real-tick validation |
| Entry size and simultaneous exposure | A: 0.01–0.06 lot, up to 6 positions/0.26 gross lot; B: 0.01–0.31, up to 7/1.36 | A/B deal lists | The same floating coefficient does not keep subsequent exposure constant |
| Stops and exit counts | Entry SL/TP: A 221/221, B 483/483; SL/TP exits: A 166/55, B 356/127 | A/B entry orders and trigger logs | SL winners: A 146 of 201, B 301 of 428; observed stops are not a full code audit |
| Net contribution by exit cause | A: TP +$3,112.15, SL −$800.38; B: TP +$22,790.84, SL −$5,418.23 | Positions paired through Journal order IDs | Larger TP winners drove net gains, despite many small profitable SL exits |
| Commission and swap charged | A: −$21.43/−$16.56; B: −$139.39/−$164.56 | A/B deal lists, reconciled balances | Included in net results; not certification of all live costs |
| Data warnings | A/B: 0% History Quality; volume errors in 291,087/294,988 and 644,224/648,125 minute bars. R0 fallback: 27,121/30,192 minute bars (89.83%); 23 whole days | A/B/R0 Journals; Figure 5 | Material limits remain even when the curves are profitable |
Extended-window check
B actually ran from January 1, 2025 to October 31, 2026. Its Settings screenshot, report and Journal agree on that longer window, despite the original filename suggesting 2025 alone. We report the period that was run. Starting again at $1,000, it returned $17,372.61, but the extra history and compounded sizing make its dollar profit unsuitable for a direct ranking against A.
Its worst relative equity drawdown was 23.32%, or $826.30 at that event. The largest monetary equity drawdown was a different event: $3,026.00, shown with 17.19%. Those two percentage measures should not be interchanged. Additionally, subtracting A’s profit from B would not create a valid 2025-only result, because B carried its own balance, sizing and position path into 2026.
Data quality and the October diagnostic
Both profitable OHLC reports show 0% History Quality. The Journals identify extensive minute-bar tick-volume errors, so we do not dismiss the flag simply because the chosen mode generates ticks. MT5’s report documentation describes History Quality in terms of minute-data consistency. The warning does not prove every price is wrong, but it prevents us from describing this history as validated market data.
We retained the outputs with those limitations rather than continuing a broker-history repair exercise. This is a bounded report of what the simulations produced. It does not establish live fills, the superiority of one broker or the behavior of every preset. The developer also says 2020–2026 periods were checked, so a different start year within that range is not automatically unseen out-of-sample evidence.
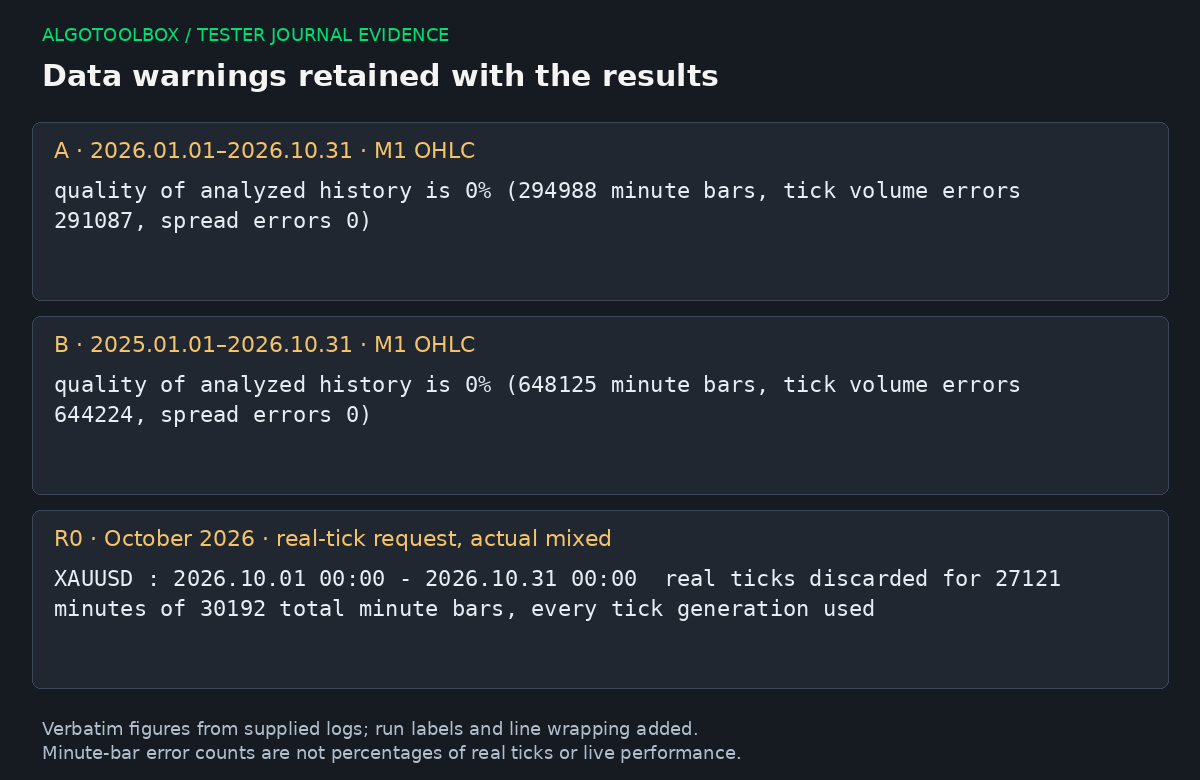
R0 covered October 2026 with real ticks requested. Its Journal records fallback generation for 27,121 of 30,192 minute bars, or 89.83%, including 23 whole days. It lost $105.98. That result stays in the evidence, but its shorter window and different balance path mean its contrast with A does not isolate a pure modeling-mode effect.
A separate-environment full-month repeat returned the same exported figures. It adds a reproducibility note, not another independent market period; the supplied terminal-only log did not establish repaired tick acceptance. We make no repair claim. There is likewise no controlled wider-spread, latency, other-symbol or complete preset-catalogue comparison in this report, and none is implied by the larger trade count.
Listing Claims vs Our Results
| Claim or feature | What we observed | Assessment |
|---|---|---|
| Combo Safe as a starting preset | Mode 15/Combo Safe initialized and completed both OHLC runs without input changes | Matches the tested setup |
| Stop-loss on entry | All recorded filled-entry orders in A and B show nonzero SL and TP | Matches the observed order records |
| No martingale, grid or averaging | Balance-scaled sizing and concurrent legs were observed; no proprietary-code audit | Partly assessed; broad implementation claim not certified |
| M1 OHLC is enough | OHLC tests ran profitably; no controlled clean real-tick/live comparison was established | Partly assessed, not equivalence validation |
| No low-latency VPS needed | Zero-latency ideal simulations only | — not testable in a demo for actual live fills |
| Prop Firm Guard and percentage limits | Four explicit percentage-loss/DD inputs were zero; no guarded variant run | — not tested |
| Recent-history Strategy Rank switching | One declared preset stayed selected; no ranking/switching evaluation | — not tested |
| Restart recovery and multi-chart behavior | No restart, VPS move or multi-chart test performed | — not tested |
The distinction between untested and unsuccessful matters. We are not declaring an unused guard ineffective or treating unavailable live-execution evidence as a failed feature. Conversely, a profitable synthetic run does not establish the listing’s broader claims. This report assesses the observed Combo Safe configuration; the other presets and the developer’s separate research process remain outside the evidence we collected.
Risk Profile and When It Fails
Hard stops help define each position’s exit, but simultaneous positions still create shared exposure. A reached six open positions and B seven, with gross open volume as high as 0.26 and 1.36 lots respectively. That is different from describing the test as a constant 0.01-lot exercise. A high win rate can coexist with larger individual losses, holding gaps and portfolio drawdowns.
Auto: Max+Guard should not be read as proof of a nonzero daily or overall account-loss ceiling. Those four explicit percentage thresholds were zero in our baseline. Wider costs, different quote paths and execution delays could change results, especially around stop management; we did not measure the size or direction of that change. Neither the $1,000 deposit nor 1:500 leverage is a live-account recommendation.
How It Compares
Our Ghost Scalper MT5 review is another gold-EA case with its own version and execution caveats. The My AI Gold MT5 review examines developer-supplied presets rather than this single Combo Safe baseline. Their deposits, periods and conditions differ, so profit figures are not a head-to-head ranking. Use the Test reports hub to compare methods and limitations before comparing headline curves.
Installing It and Testing It Yourself
Install the official Market demo in MT5 and select Market\Gold Beaver.ex5 in Strategy Tester. Keep the distinction between chart period and tick model: our chart was M15, while the main simulations used 1 minute OHLC. Record your actual EA version and symbol suffix rather than assuming another broker’s gold contract or current preset catalogue matches the configuration described here.
- Choose a preset and periods before inspecting outcomes; do not select the recent-history winner afterward.
- Capture the inputs and save a baseline set. Check whether fixed or floating sizing is active and which loss limits are nonzero.
- Set virtual deposit, leverage, model and delay explicitly. Run one baseline and one or two useful checks without outcome-driven tuning.
- Save each completed HTML report and its graphs before changing dates. Keep the ordinary Tester Journal where available and label known data limits.
- Read drawdown, exposure, costs and completion status alongside profit. A losing or zero-trade run is evidence too, not a prompt to hide or repeatedly retune it.
Use your exact terminal, broker/server, symbol, account type and available cost assumptions, without expecting a different setup necessarily to perform better. If you already hold a licensed copy capable of running outside the tester, at least 90 days on a non-funded demo account would be a separate execution check. No such forward-account result is included here, and it would still not establish future performance.
Advantages and Disadvantages
Advantages observed in these tests
- Combo Safe and Auto could be held constant without a preset-selection sweep.
- Both main simulations completed profitably, and their deal totals reconcile to the reported balances.
- The recorded entry orders carried SL and TP values, with observable subsequent stop management.
- Grouped inputs expose sizing, spread eligibility and separate loss-limit settings for inspection.
Limitations and disadvantages
- Both main reports carry 0% History Quality and extensive tick-volume warnings.
- The extended run overlaps the primary period rather than providing an independent 2025-only holdout.
- Floating sizing and concurrent legs increase exposure as the account path develops.
- Explicit percentage-based account-loss limits were off; their protective behavior was not measured.
- Ideal synthetic fills, other presets and untested operational features do not establish live performance.
Source, Licence and Distribution
- Rights
- Commercial product
- Developer
- Arnold Bobrinskii
- Licence
- Commercial (MQL5 Market)
- Official price
- $449
- Version tested
- 5.57
- Tool type
- Expert Advisor
Commercial product. This report covers the trading logic and our own test results. Purchase, licensing, support and updates are handled by the developer via the official page. AlgoToolbox does not sell, host or sublicense this software.
How we tested it. We downloaded the free demo version from the developer’s official MQL5 Market page and ran it in the MetaTrader 5 Strategy Tester. Market demo versions only run in the Strategy Tester. The performance results from our own tests in this report are backtests, not live or forward trading. We did not buy a licence and did not receive a free copy or any payment from the developer. The developer did not see or approve this report before publication. We earn nothing if you buy this product. How we test and score.
Frequently Asked Questions
What does this Gold Beaver MT5 review actually test?
It tests version 5.57 with Combo Safe and Auto on Exness Raw XAUUSD, using an M15 chart and a $1,000 virtual starting deposit. A covers January–October 2026; B actually extends January 2025–October 2026. Both are M1 OHLC simulations, while the separate October diagnostic used mixed real/generated ticks. This is not a review of every preset or a live trading record.
Do these records prove there is no martingale or averaging?
No. They show balance-scaled volume, multiple concurrent legs and entry orders with stops and targets in the tested runs. Larger later lots are not automatically martingale, just as several simultaneous positions do not by themselves establish an averaging mechanism. We did not audit the proprietary code or validate every market condition, so the implementation claim is only partly assessed.
Is $1,000 at 1:500 the recommended live setup?
Those are virtual test conditions, not a measured safe minimum or a live-capital recommendation. Fixed-lot mode was off, and the 11.6 coefficient is not 11.6% risk per trade. Broker minimum volume, contract specifications, stop distances and simultaneous exposure matter. We did not establish a generally safe live deposit from these simulations.
Does a profitable OHLC backtest establish live profitability?
A profitable OHLC result does not establish live profitability: the model generates a simplified quote path, and our tests assumed ideal execution while reporting substantial history warnings. The original October mixed-tick diagnostic also lost, under a different window and balance path. The evidence supports reporting those modeled outcomes, not a clean live or real-tick equivalence claim. Retest the stated configuration and inspect its limitations before making a purchase decision.
Final Verdict
This Gold Beaver MT5 review scores the tested configuration 3.0 out of 5. Strong OHLC outputs count in its favor, while overlapping evidence, data warnings and stacked exposure keep confidence low. Independent testers have a concrete baseline to explore, but anyone seeking established live returns, verified prop-account compliance or a complete preset-catalogue assessment needs evidence this report does not supply.
Our conclusion is deliberately narrower than either endorsing the product from its profitable curves or dismissing it from one losing diagnostic. Keep the stated conditions and the uncertainty attached to the numbers, then use the official demo to assess your own setup. Profitable in our OHLC runs, but data warnings and unverified live execution keep confidence low.
⚠️ Risk & Transparency Notice: All indicators, scripts, and backtest results on AlgoToolbox are for educational and testing purposes only. Trading Forex, CFDs, and cryptocurrencies carries significant financial risk. Past performance does not guarantee future results. This article may contain contextual affiliate links to tools or brokers we use. Read our full Risk Disclaimer.