Absolute vs Relative Drawdown in MT5: The Number That Actually Matters
MT5 prints six drawdown cells across Balance and Equity. Here is what Absolute, Maximal, and Relative each measure — and why Equity Relative DD matters most.
Every MetaTrader 5 backtest prints six drawdown figures, and EA sellers almost always quote whichever one looks smallest. Sorting out absolute vs relative drawdown MT5 formulas — and separating closed-balance dips from open-equity plunges — is the fastest way to spot a grid or averaging bot hiding floating losses behind a smooth balance line.
This guide explains how MT5 calculates Absolute, Maximal, and Relative drawdown on both Balance and Equity curves, illustrates the gap using real reports published on AlgoToolbox, and gives you a practical pre-deployment checklist.
On this page8 sections
- The Two Curves and Three Numbers in an MT5 Report
- Why Equity and Balance Diverge — and Why That Gap Is the Signal
- Why Maximum Drawdown Is a Historical Sample, Not a Ceiling
- Cent Accounts and Report Units: The Comparability Trap
- Reading Drawdown Alongside Recovery Factor
- A Practical Drawdown Review Checklist
- Where to Go Next
- FAQ
The Two Curves and Three Numbers in an MT5 Report
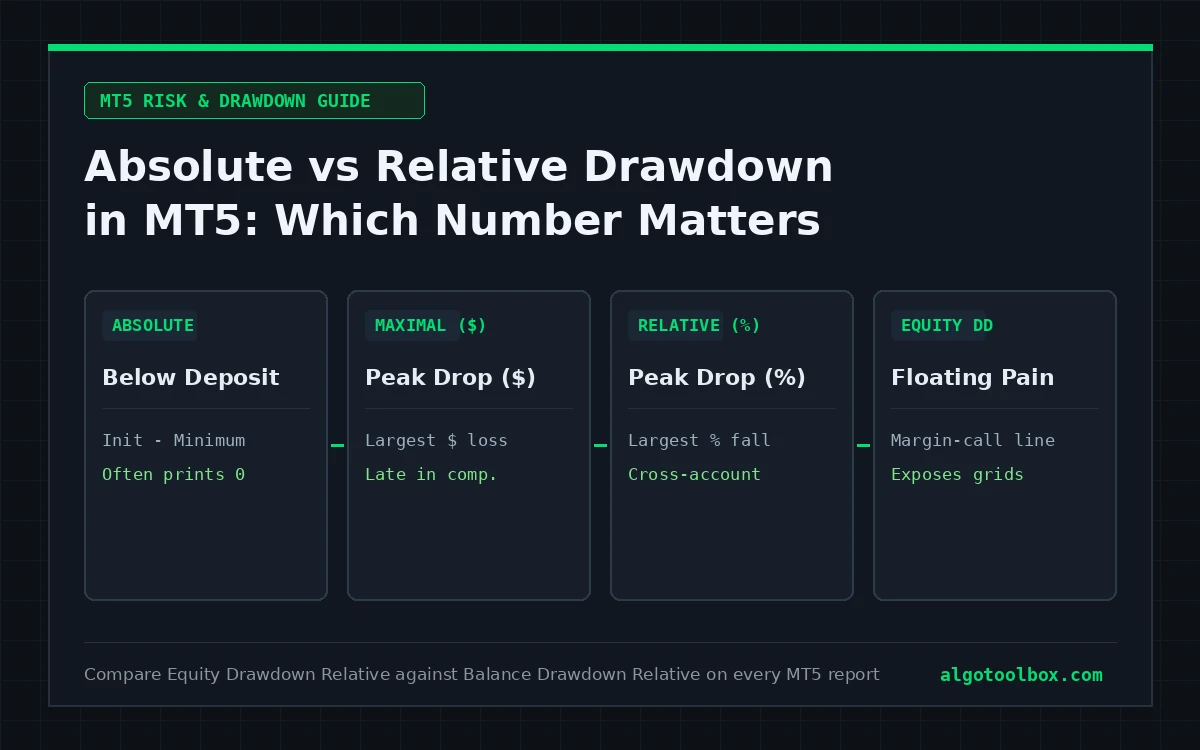
MetaTrader 5 does not print just three drawdown numbers — it prints three metrics across two separate curves (six cells in total): one row for Balance (realized closed trades only) and one row for Equity (real-time account value including floating profit and loss on open positions).
On each curve, the three columns measure distinct drops:
- Absolute Drawdown: how far Balance or Equity fell below your initial starting deposit (
Initial Deposit − Minimum Point). It is the easiest metric to misread because once early profits lift an account well above its starting deposit, huge later losses that remain above the initial deposit still leave Absolute Drawdown at0.00. - Maximal Drawdown: the largest peak-to-trough drop measured in deposit currency, with its percentage at that peak shown in parentheses (for example
$2,400.00 (24.00%)on a$10,000peak). - Relative Drawdown: the largest peak-to-trough drop measured as a percentage, with its currency value in parentheses (for example
35.00% ($350.00)early in the run on a$1,000peak — larger in percentage terms than24%, even though smaller in dollars).
| MT5 report cell | What it measures | Counts floating open losses? | Comparable across deposit sizes? |
|---|---|---|---|
| Balance Drawdown Absolute | Closed-balance drop below starting deposit | No | No (raw currency) |
| Balance Drawdown Maximal | Largest currency drop between closed-balance peaks/troughs | No | Only via the (%) in brackets |
| Balance Drawdown Relative | Largest percentage drop on closed balance | No | Yes, for closed trades only |
| Equity Drawdown Absolute | Floating-equity drop below starting deposit | Yes | No (raw currency) |
| Equity Drawdown Maximal | Largest currency drop on real-time equity | Yes | Only via the (%) in brackets |
| Equity Drawdown Relative | Largest percentage drop on real-time equity | Yes | Yes — the primary risk metric |
When traders compare absolute vs relative drawdown MT5 figures, Equity Drawdown Relative is the number that reflects reality: brokers trigger stop-outs on live floating equity, never on closed balance.
Why Equity and Balance Diverge — and Why That Gap Is the Signal
An EA that protects every position with a hard stop-loss and closes losers promptly produces Balance and Equity drawdowns that sit within a percentage point or two of each other. An EA that refuses to close losers — holding underwater baskets or stacking martingale/grid lots until price bounces — prints a calm blue Balance staircase with deep green Equity spikes hanging underneath it.
Three published runs on AlgoToolbox show three completely different risk profiles once you read those columns side by side:
- Icarus Grid Bias MT5 (stacked grid exposure): printed
0.00Absolute Drawdown and16.08%Balance Drawdown Relative — while Equity Drawdown Relative hit50.81%. Anyone quoting only Balance or Absolute drawdown would miss more than two-thirds of the floating drawdown the account actually endured. - My AI Gold MT5 (inverted stop-to-target compounding): no martingale or grid, yet on its Aggressive set the account compounded from
$2,000to$59,629by November 2022 and then erased90.24%of its peak balance between November 2022 and May 2023 while Absolute Drawdown stayed tiny relative to the peak. - Ghost Scalper MT5 (hard exits, stagnation risk): Balance Drawdown Relative (
14.57%) and Equity Drawdown Relative (14.93%) tracked closely because every deal carried a fixed lot and hard exit — yet the curve went nine months (`245` days) without making a new high. Time under water is a separate risk no drawdown percentage prints directly.
Why Maximum Drawdown Is a Historical Sample, Not a Ceiling
Reading Equity Drawdown Relative: 18% does not mean your live account will stop falling at 18%. It means the single worst historical trajectory inside that tested sample stopped at 18%. Live drawdowns routinely exceed backtested drawdowns for four reasons:
- Short test windows miss adverse regimes. Our 15M Gold Scalper real-tick test spans four months (
2026-06-08to2026-10-08); four months verifies mechanics over that summer window, not worst-case multi-year gold shocks. - Synthetic ticks smooth intrabar whipsaws. Low History Quality understates floating equity spikes inside volatile candles.
- Parameter selection biases the minimum downward. Whenever settings or set files were picked after inspecting historical runs, drawdown was minimized on that exact price path by construction.
- Live execution friction adds directly to every losing streak. Wider news spreads, commission, and stop slippage deepen every valley simultaneously.
Cent Accounts and Report Units: The Comparability Trap
MetaTrader 5 prints currency figures in whatever deposit unit the broker account uses — USD, EUR, or cent units (`USC`). On 15M Gold Scalper, an initial deposit of 10,000 USC represents roughly $100 USD; on Icarus Grid Bias, the tester report prints 15,000 report units on an Exness cent account.
Two habits prevent embarrassing math errors:
- Never compare raw dollar profit or Maximal (`$`) drawdown across reports without checking the deposit currency and cent multiplier.
- Normalize to Equity Drawdown Relative (`%`) and test duration first. Percentages survive unit changes; raw currency totals do not.
Reading Drawdown Alongside Recovery Factor
MT5 computes Recovery Factor as Total Net Profit ÷ Maximal Drawdown. It is a fair measure when comparing two parameter sets run over the exact same multi-year date span and deposit rules, and easy to game by cropping the test window around a clean three-month trend. Never treat Recovery Factor as a standalone safety badge without checking total months tested and Equity Drawdown Relative.
A Practical Drawdown Review Checklist
- Record both Balance Drawdown Relative and Equity Drawdown Relative, plus the deposit unit and leverage
- Flag any wide Equity-over-Balance gap as floating open-basket risk
- Ignore a
0.00Absolute Drawdown on any run that booked early profits - Inspect the equity graph for multi-month flat stretches (`days under water`), not just vertical drops
- Re-run the EA at
2×spread and check how fast Equity Drawdown Relative expands - Write down the exact floating equity percentage at which you would pull the plug before looking at Net Profit
Where to Go Next
- How to Read an MT5 Strategy Tester Report, Line by Line — how drawdown fits into the full 60-second report audit
- MT5 Modeling Quality Explained — why synthetic M1 ticks understate intrabar equity drawdowns
- How We Test — how Risk & Drawdown Control is weighted inside our 5-point EA rubric
FAQ
What is the difference between absolute vs relative drawdown MT5 reports display?
Absolute Drawdown measures only how far your account dipped below its initial deposit in currency, so it often reads 0.00 even after massive mid-run crashes. Relative Drawdown measures the largest peak-to-trough percentage drop from any high watermark achieved during the test.
What is the difference between Maximal Drawdown and Relative Drawdown in MT5?
On a compounding account, the biggest dollar drop and the biggest percentage drop can happen at different times. Maximal Drawdown records the largest peak-to-trough drop in deposit currency, whereas Relative Drawdown records the largest peak-to-trough drop in percentage terms.
Should I quote Balance Drawdown or Equity Drawdown when evaluating an EA?
Always quote Equity Drawdown Relative alongside the test dates and leverage. Balance Drawdown ignores unrealized losses on open positions, which is exactly where grid, averaging, and no-stop-loss EAs store their risk until margin runs out.
Is a 50% Equity Drawdown Relative ever acceptable?
Only if you explicitly treat the account as high-risk speculative capital sized accordingly before starting. Ask yourself honestly whether you would watch half your live equity evaporate in floating positions without manually closing the basket at the bottom.
Does a 10% backtested Equity Drawdown mean my live account is safe?
No. Backtested drawdown is the worst historical observation inside one sample under tester execution assumptions, not an upper bound on future losses. Short windows, synthetic ticks, and zero-slippage fills all compress historical drawdown below live reality.
Risk & Transparency Notice: All indicators, scripts, and backtest results on AlgoToolbox are for educational and testing purposes only. Trading Forex, CFDs, and cryptocurrencies carries significant financial risk. Past performance does not guarantee future results. Read our full Risk Disclaimer.