MT5 Modeling Quality Explained: Real Ticks vs OHLC (And What History Quality Means)
Every middle report in our table requested real ticks and ran partly on synthetic data. Here is what MT5 History Quality really measures and how to check it.
Almost every heated argument about backtests online comes down to a single header field most traders skim past: History Quality, often discussed under the older MT4 label of MT5 modeling quality. In MetaTrader 5, that percentage records how much of your test window used real server tick data rather than synthetic ticks interpolated from one-minute bars.
It is not a grade for your Expert Advisor. It is a coverage statement about the price series underneath it — and the runs published on AlgoToolbox span the entire spectrum from 0% to 100%, making the real-world effect easy to inspect directly.
On this page8 sections
The Actual Distribution Across Published Runs on This Site
| Published report | Mode selected in tester | Reported History Quality | What actually ran underneath |
|---|---|---|---|
| Gold Beaver MT5 (Run A) | 1 minute OHLC | 0% | 100% synthetic four-point M1 candles; all performance ratios describe generated ticks. |
| Scalping Robot Pro MT5 | Every tick based on real ticks | Generated fallback | Journal discarded all 144,033 minutes of mismatched data; tester ran on generated ticks despite the dropdown choice. |
| My AI Gold MT5 | Every tick based on real ticks | 4–7% | Multi-year 2020–2026 span where over nine-tenths of tick flow was synthesized from M1 bars. |
| Lizard EA MT5 (Run 1) | Every tick based on real ticks | 15% | Mostly generated ticks across the longer historical span. |
| Ghost Scalper MT5 | Every tick based on real ticks | 28% | Roughly one-quarter real server ticks, three-quarters generated interpolation. |
| Lizard EA MT5 (Runs 2–3) | Every tick based on real ticks | 70% | Strongest real-tick share among our multi-year third-party EA tests. |
| 15M Gold Scalper | Every tick based on real ticks | 100% | 27,784,252 real ticks across 8,054 M15 bars over a focused four-month window. |
Look closely at rows two through six: every one of those runs had “Every tick based on real ticks” selected in the Strategy Tester, and every one executed partly or wholly on synthetic ticks. Selecting the mode asks the broker server for tick archives; the History Quality line and Journal log tell you whether the server actually supplied them.
MT5’s Five Modelling Modes, Ranked by What They Can Show
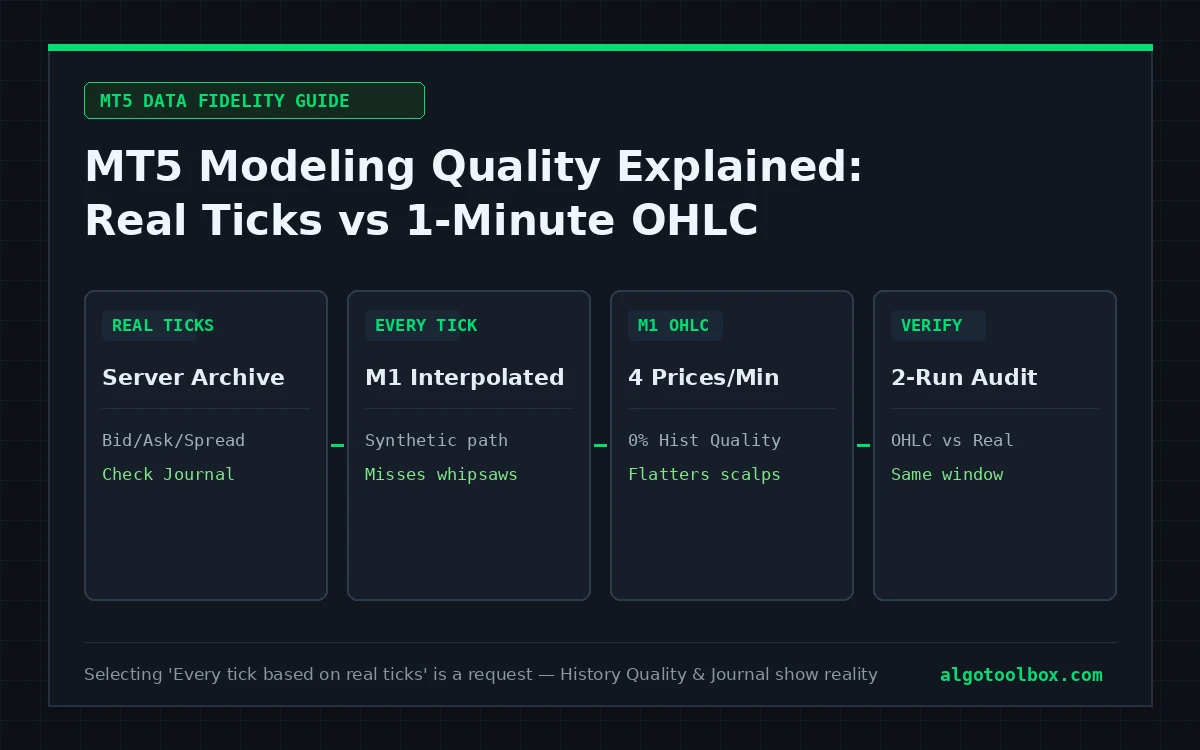
- Every tick based on real ticks: the highest-fidelity mode in MetaTrader 5. It replays archived bid, ask, and spread changes from your broker server where they exist, and silently fills missing intervals with generated M1 ticks unless you inspect History Quality and the Journal tab.
- Every tick: synthesizes intrabar price paths inside each M1 candle from Open, High, Low, and Close. Reasonable for strategies that decide once per closed M15 or H1 candle with wide stops; unreliable whenever tight stops, trailing steps, or grid entries fire inside a single one-minute bar.
- 1 minute OHLC: feeds only four price points per minute in a deterministic sequence. If both your stop-loss and take-profit sit inside the same volatile M1 candle, the tester’s internal sequence decides which level triggered first — frequently flattering tight-target scalpers.
- Open prices only: evaluates once at the opening price of each bar on the tested timeframe. Fast for sanity-checking code that explicitly checks for a new bar open before trading, and misleading for any EA with intrabar stops, pending orders, or trailing exits.
- Math calculations: bypasses price history completely to evaluate pure mathematical expressions inside
OnTester(). Never used to simulate trading strategies.
Why the Percentage Is Not the Whole Story
Treating MT5 modeling quality as a rigid pass/fail threshold misses how synthetic tick generation distorts different trading styles:
- Tight scalpers and fast trailing stops suffer severe optimism bias on low quality. Interpolated paths smooth out real bid-ask whipsaws and micro-spikes that knock out 30-to-80-point gold stops in live trading.
- Grid and martingale EAs look artificially calm on coarse models. Because grids survive until an unretraced excursion exhausts margin, smoothed M1 OHLC paths understate sudden intrabar equity spikes and variable spread blowouts.
- Bar-close swing systems with wide stops are far less sensitive. An H1 or H4 trend follower that enters only at bar open and places a 2.5-ATR stop rarely hinges on sub-minute tick sequencing — a 30% real-tick run tells you much more about that EA than the exact same 30% figure tells you about an M1 scalper.
How to Check What Your Backtest Actually Ran On
Check four places in order whenever you audit a report:
- The History Quality bar in the report header: read the percentage before reading Net Profit or Profit Factor.
- The Strategy Tester Journal tab: search the log for
real ticks,discarded,mismatch, orticks synchronized. As Scalping Robot Pro demonstrated, a report can request real ticks and still have every minute of tick archive rejected in the Journal. - Printed Ticks vs Bars counts: divide total ticks by total M1 minutes in the date window. Four months of real XAUUSD ticks easily exceeds 20–30 million ticks; a five-year report showing two million ticks did not run on dense tick data.
- Cross-server replication: re-run the identical
.setfile on a second broker’s raw-spread server over a recent 3-to-6-month window where 99–100% real ticks are available.
How to Improve Real-Tick Coverage
- Pre-fetch tick archives manually before testing: press Ctrl+U (View → Symbols), select your symbol, switch to the Bars and Ticks tabs, set your start/end dates, and click Request so you see the exact date where your broker’s real-tick archive actually begins.
- Separate long regime checks from recent real-tick checks: brokers rarely store 100% tick data back to 2020. Run a multi-year pass with its mixed-tick limits disclosed alongside a recent 4-to-12-month window at ~99–100% real ticks rather than pretending one pass gives both.
- Import verified custom symbol ticks when needed: MT5 lets you create a custom symbol under Ctrl+U → Create Custom Symbol and import external tick CSV archives if your broker’s native tick history is shallow.
- Keep Max bars in chart Unlimited for deep tests: check Tools → Options → Charts so chart lookbacks never truncate prematurely.
The Two-Run Comparison That Settles It
When you want to know how heavily synthetic modelling flatters one specific EA, run the exact same inputs over a recent 3-to-6-month window where your broker holds ~100% real ticks: once on 1 minute OHLC and once on Every tick based on real ticks.
Compare four outputs side by side: Total Trades, Profit Factor, Equity Drawdown Relative, and the visual slope of the equity curve. If the two runs match closely, the EA’s logic is genuinely bar-close driven. If a smooth 2.80 Profit Factor on M1 OHLC collapses to 0.92 on real ticks, the edge never existed — you were measuring the tester’s OHLC interpolation sequence.
Where to Go Next
- How to Read an MT5 Strategy Tester Report, Line by Line — how History Quality interacts with expected payoff, trade count, and equity drawdown
- How We Test — our bounded-testing rules for disclosing generated, mixed, and real-tick simulations honestly
- Scalping Robot Pro MT5 Test Report and Gold Beaver MT5 Test Report — worked examples of synthetic-tick disclosures in practice
FAQ
What does 99% or 100% History Quality mean for MT5 modeling quality?
It means 99% to 100% of the tested period was covered by archived server ticks rather than M1-interpolated ticks without mismatched-bar errors. It confirms strong historical data coverage, not future live profitability or slippage immunity.
Why does MT5 show 4% or 15% History Quality when I chose “Every tick based on real ticks”?
Because your broker server only stores tick-by-tick archives back to a certain cutoff date (often the most recent 6 to 18 months). For every earlier year in your date range, MetaTrader 5 automatically substitutes synthetic ticks generated from M1 bars and lowers the History Quality percentage accordingly.
Is 1 minute OHLC mode ever acceptable for evaluating an MT5 EA?
Yes as a fast, clearly labelled simulation check — especially when a developer explicitly designs an EA around bar-open decisions — provided you do not mistake a synthetic M1 OHLC curve for real-tick intrabar execution. Always cross-check a recent real-tick window before risking live capital.
Does higher History Quality usually improve backtest results?
Almost always the opposite: switching from M1 OHLC or generated ticks to 100% real ticks typically lowers Profit Factor and widens drawdown, because real ticks reintroduce variable spread spikes and adverse intrabar whipsaws that synthetic paths smooth away.
Where can I check the exact number of real ticks my MT5 run processed?
Look at the Ticks and Bars cells in the top header of the HTML Strategy Tester report, then verify in the Strategy Tester Journal tab that those ticks were synchronized from tick history rather than generated or discarded.
Risk & Transparency Notice: All indicators, scripts, and backtest results on AlgoToolbox are for educational and testing purposes only. Trading Forex, CFDs, and cryptocurrencies carries significant financial risk. Past performance does not guarantee future results. Read our full Risk Disclaimer.