EMA Cross 5TP MT5 Port
We ported an EMA confirmation study with five targets to MT5. Three default-setting gold charts show why EMA exits, break-even and target hits tell different stories.
EMA Cross 5TP puts entries and exits on the same chart, but the interesting question is where a trade actually finishes.
The first modern Olympic marathon was about 40 kilometers. The now-familiar 42.195-kilometer distance appeared at London 1908 and became official in 1921. Olympics.com Apparently, even running needed a few revisions before everyone agreed where to stop.
On this page11 sections
- Test Bench
- Read one setup: cross, confirm, then plan
- Same defaults, different exit mix
- Start with a question, not a prettier panel
- Our take: the exit mix is more useful than another arrow
- Inputs and defaults
- Eight buffers for inspecting the indicator
- What the panel cannot tell you
- Source, Licence and Distribution
- Frequently asked questions
- Original strategy and MT5 adaptation
Test Bench
| Specification | Our configuration |
|---|---|
| Platform | MetaTrader 5 |
| Tool type | Indicator |
| Version tested | 1.00 |
| Symbol / timeframe | Exness XAUUSDc M1 / M5 / M15 |
| Test period | Default 3,000-bar initial replay per chart; different calendar spans |
| Data / tick mode | Closed-bar OHLC chart simulation; source compiled without errors; three chart examples |
| Account & spread | Exness chart feed; spread, commission and slippage not modeled |
Read one setup: cross, confirm, then plan
Trading gives us rather more freedom to move the finish line—and plenty of opportunities to regret it. An EMA cross gets our attention, but then comes the awkward part: take a small profit, wait for a bigger target, move the stop, or get out when the move starts falling apart?
Our free EMA Cross 5TP indicator for MT5 puts that plan on the chart: a confirming close beyond four EMA lines, a next-bar reference entry, a candle-based stop and five fixed-distance targets. Those targets are milestones along the way; touching TP1 doesn’t mean part of the position has closed. The simulated trade keeps going until an exit rule ends it.
And the five targets don’t always get much exercise. In our default-setting XAUUSDc snapshots, the EMA rule ended about 80% of simulated trades on M1 and half on M5. On M15, break-even was the most common finish. Before getting attached to TP5, it’s worth seeing where the trades actually leave.
This is an indicator, not an EA. It draws and simulates a trade plan. It doesn’t place orders, protect a broker position or report your account’s trading results.
The chart shows EMA 13 in blue and EMA 21 in red, plus a 14-period EMA smoothing of each in yellow. The yellow lines smooth the two existing EMAs; they aren’t two more averages taken directly from price.
- Wait for a cross. EMA 13 crossing above EMA 21 sets up a long; crossing below sets up a short.
- Wait for a confirming close. By default, the indicator allows three bars, including the cross candle. A long needs a close above all four lines. A short needs a close below all four.
- Read the next bar’s open as the reference entry. The confirming signal and its entry arrow belong to different candles. That is intentional.
- Follow the exit plan. The stop uses the Nth candle back, with an optional buffer. Default targets are 10, 20, 30, 40 and 50 price units from entry. A five-unit move triggers the default break-even adjustment. A close back beyond both the fast and slow EMAs against the trade can end it early.
So the cross alone isn’t enough. Price has to close beyond all four lines before the indicator accepts the setup. Sideways price can still cross, confirm and promptly turn back despite that extra condition. The indicator tracks one simulated trade at a time and accepts at most one entry per cross.
Five targets do not mean five partial exits. Earlier targets record progress. The simulated position closes at the final enabled target, the stop, or the configured EMA exit. A trade can touch TP1 and still finish at break-even later.
Same defaults, different exit mix
We used Exness XAUUSDc on M1, M5 and M15, keeping the default settings and the default 3,000-bar initial replay window. The updated source compiled without errors, and the screenshots show the indicator running on those charts.
These are chart-history simulations, not Strategy Tester execution reports. Also, 3,000 one-minute bars cover a different calendar span from 3,000 fifteen-minute bars. We’re looking at how the same settings behave in these examples, not holding a fair contest for the most profitable timeframe.
| Panel measure | M1 | M5 | M15 |
|---|---|---|---|
| Closed simulated trades | 114 | 120 | 112 |
| TP1 / TP2 / TP3 / TP4 / TP5 hits | 13 / 2 / 1 / 1 / 0 | 30 / 15 / 11 / 7 / 5 | 38 / 19 / 11 / 7 / 5 |
| Closed at TP5 | 0 | 5 | 5 |
| SL exits | 11 | 22 | 15 |
| Break-even exits | 12 | 33 | 56 |
| Trailing-stop exits | 0 | 0 | 0 |
| EMA exits | 91 | 60 | 36 |
| Displayed win rate | 31.6% | 20.8% | 14.3% |
| Simulated net price move | +41.01 | +177.78 | +9.21 |
M1: the EMA exit does most of the work
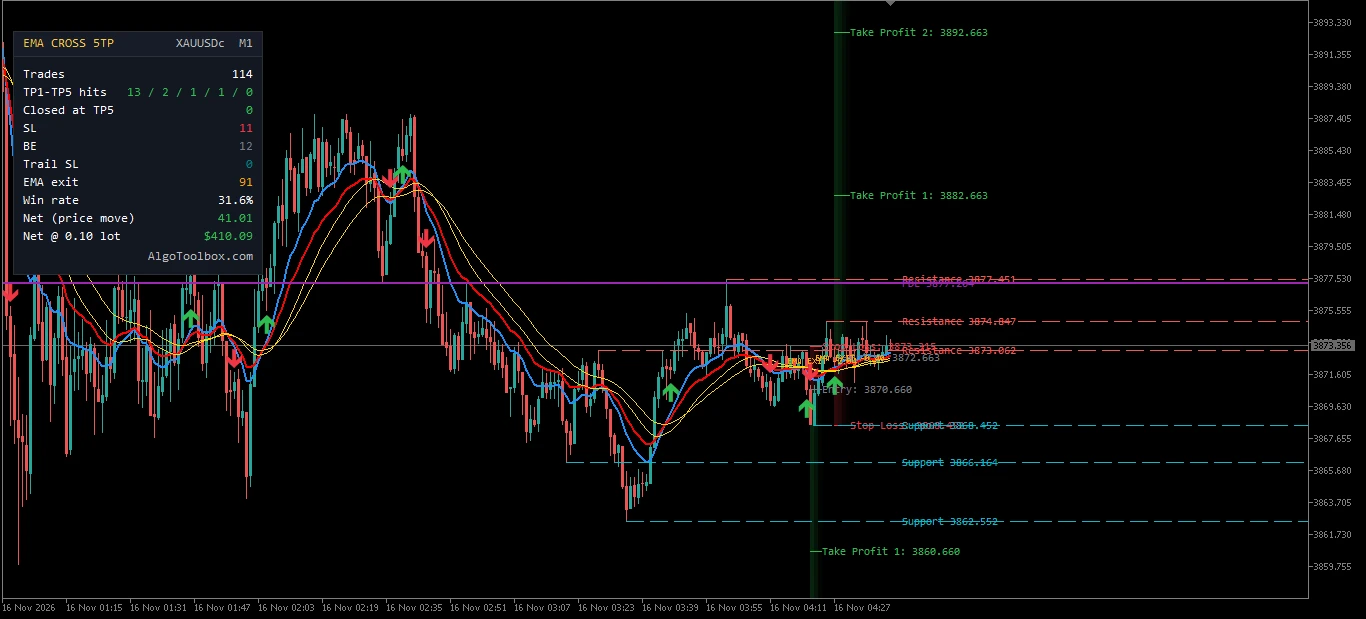
On M1, the EMA rule ended 91 of 114 trades—79.8%. Only 13 touched TP1, and none finished at TP5. For these distances and this history, the EMA exit is doing most of the work. The five-target ladder is there, but very few trades get far along it.
That’s worth knowing before building expectations around the last target. If the plan depends on most trades traveling 50 price units before the EMA exit steps in, this snapshot gives us a reason to rethink that assumption.
M5: more of the ladder comes into play
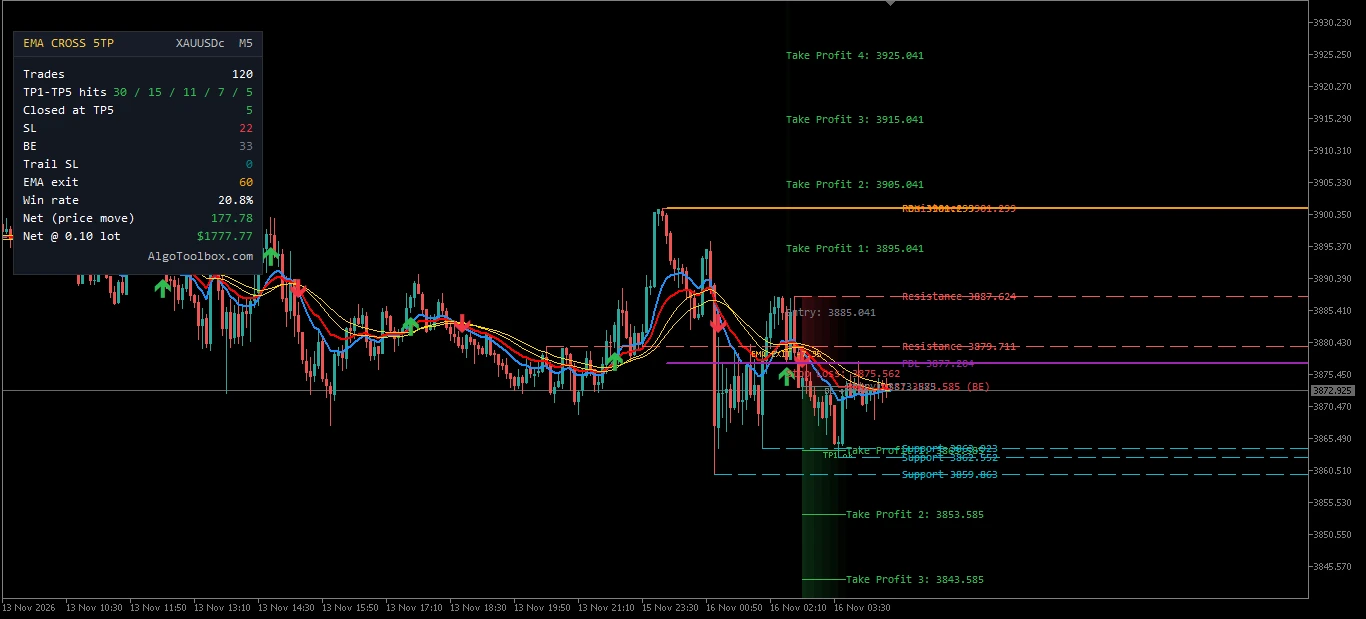
On M5, half the trades ended through the EMA rule: 60 out of 120. The rest were 33 break-even exits, 22 stop exits and five final-target closures. Thirty trades touched TP1, so more of the ladder came into play than on M1.
M5 also has the largest simulated net price move of the three snapshots, +177.78. That doesn’t make it the best timeframe. Its 3,000 bars cover a different stretch of the market, so this isn’t a matched-period result.
M15: more TP1 touches, but not a better net result
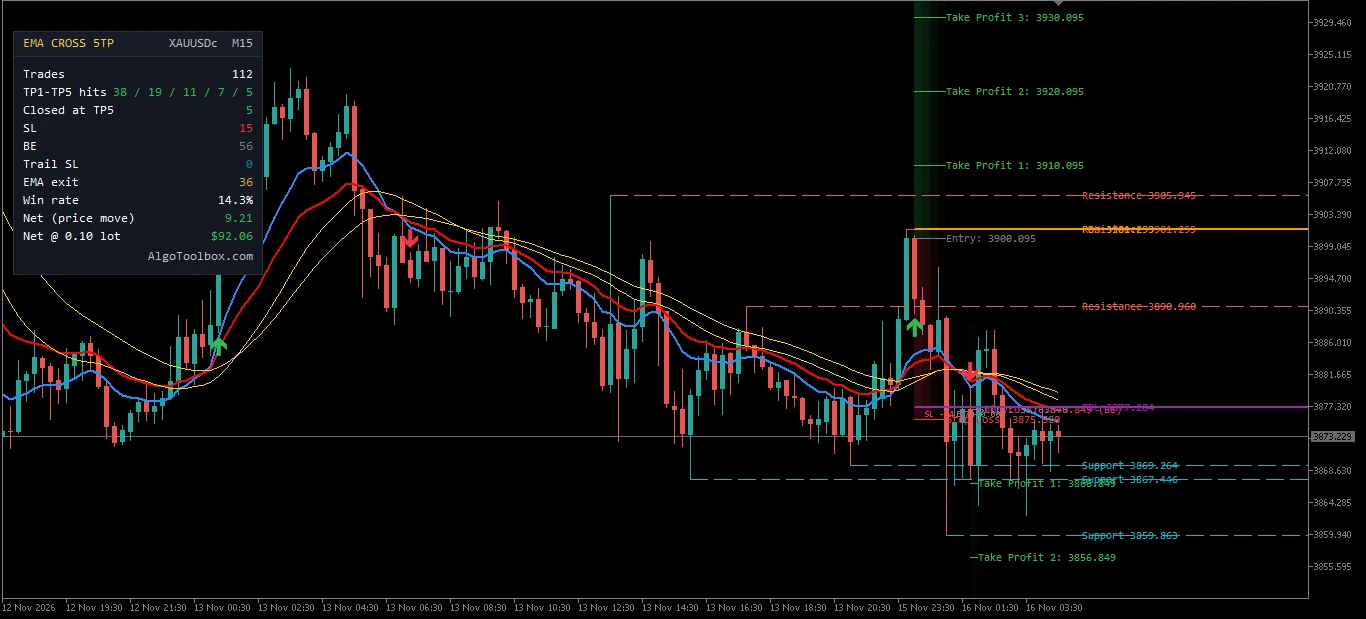
M15 makes the difference between touching a target and keeping a profit quite clear. It has 38 TP1 hits, more than M5, but the same five TP5 closures. Half its trades ended at break-even, and the simulated net price move was just +9.21.
The panel counts a win when a closed trade has a positive final price move. A zero-price-move break-even exit isn’t a win, even if the trade visited TP1 earlier. The target-hit counts tell us how far trades went; the win rate tells us how many finished positive. They’re different questions.
Start with a question, not a prettier panel
- In MT5, open File → Open Data Folder. Copy
EMA Cross 5TP.mq5intoMQL5/Indicators/. - Open the file in MetaEditor and press F7 to compile. Refresh Navigator, then attach the indicator to a chart.
- Leave the defaults alone for the first walkthrough. Pick a signal and follow it from the confirming candle to the next-bar entry and eventual exit.
- Check your symbol’s quote convention before copying target distances. These are price units, not account-dollar risk.
- Then choose something to investigate. Does the EMA exit usually end the trade before a target? What happens with shorter target distances? Change one relevant setting at a time so you can see what caused the difference.
For a typical USD-quoted gold symbol, a 10-unit target means a price move such as 3880 to 3890. It does not mean a $10 account profit. The panel’s dollar estimate multiplies net price movement by the lot and contract inputs. It doesn’t calculate your broker account’s actual result or include trading costs.
We suggest opening the default M5 setup first. That’s the original publication’s intended chart, and it sits between the faster M1 and slower M15 examples here. It’s a starting point for getting familiar with the tool, not a performance recommendation.
For a fairer timeframe comparison, use the same date range and a suitable replay scope. Record how trades end—EMA, stop, break-even or final target—rather than comparing the biggest displayed total alone. Our screenshots don’t provide that matched comparison. Our testing approach explains why chart examples and execution backtests stay separate.
Our take: the exit mix is more useful than another arrow
There’s nothing unfamiliar about an EMA cross. What helps here is seeing what happens after it. On M1, the five targets barely feature in the final exits. On M15, more early target touches don’t translate into a stronger net result. Those are things an entry arrow alone won’t tell us.
We like this as a visual study tool and a helper for discretionary trading. The stop comes from a candle you can locate, the reference levels give the plan some context, and the panel lets you follow more than the entry. The stop distance changes with candle geometry, though; it isn’t adjusted for volatility in the way an ATR-based rule would be.
The fixed targets need the same attention. They won’t resize themselves when volatility changes or when you switch instruments. Keep the original settings as a baseline, then see whether a change answers your question. A larger number on the panel is tempting, but it isn’t a trading system by itself.
Inputs and defaults
| Group | Default / consequence |
|---|---|
| EMAs | 13 and 21; each smoothed with EMA length 14. |
| Entry | Buys and sells on; confirmation window 3 bars, including the cross candle. |
| Stop | Nth candle back = 5; buffer 0. Invalid-side stops cause the proposed entry to be skipped. |
| Break-even | Trigger 5 price units; offset 0. Trigger 0 disables this adjustment. |
| Targets | Five, at distances 10 / 20 / 30 / 40 / 50. Final enabled target closes the simulated trade; earlier hits are milestones. |
| Trailing by targets | Off. When enabled, TP1 can move the stop to entry plus offset; later hits move it through earlier targets. |
| Early exit | Close beyond both EMA 13 and EMA 21 against the trade. Alternatives: off, fast EMA only, or all four lines. |
| Reference levels | Previous-day high/low on; pivot support/resistance on; left/right 10 bars; three levels per side. |
| Replay and drawings | Initial replay 3,000 bars; keep two past trade drawings. Zero selects all for each respective option, subject to available history. |
| Display | Zones and stats on; projection 30 bars; six fade strips; panel X=10, Y=30. |
| Dollar estimate | Lot 0.10 × contract 100. A display conversion, not position sizing. |
| Alerts | Popup and push off; optional alerts describe a new confirmed signal. |
The two-drawing default only keeps the chart tidy. It doesn’t limit the stats panel to two trades: replay scope controls the historical simulation, while drawing retention controls how much stays visible. The documentation links in the updated source are informational strings, not calculation settings.
Eight buffers for inspecting the indicator
| Index | Output |
|---|---|
| 0 / 1 | Fast / slow EMA. |
| 2 / 3 | Smoothed fast / slow EMA. |
| 4 / 5 | Buy / sell entry arrows on the entry bar. |
| 6 | Signal direction: +1 buy, −1 sell, on the confirming signal bar. |
| 7 | Simulated trade direction: +1 long, −1 short, 0 flat. |
If you’re reading the indicator from an EA, keep the signal bar and entry bar separate. For a completed signal, read buffer 6 at shift 1 and use a new-bar check in the EA. Buffers 4 and 5 hold the next-bar entry markers. Buffer 7 reports the indicator’s simulated state, not a position held with your broker.
The EMA lines can move on the forming bar; signal decisions use completed candles. When supplying explicit custom inputs through iCustom, follow the final source’s declaration order, including the informational documentation strings. Reading a signal buffer doesn’t add order execution, money management or reconciliation with existing positions. Those remain the consuming EA’s job.
What the panel cannot tell you
The simulation works from candle OHLC, not the full tick-by-tick path. If an existing stop and a target compete on the same candle, it assumes the stop was hit first. It then checks targets in sequence, followed by the EMA exit. Break-even and target-trailing adjustments don’t reconstruct every move inside that candle. Knowing the priority helps explain the results; it doesn’t make the whole simulation a conservative substitute for real fills.
Spread, commission, slippage, margin and account equity aren’t modeled. The indicator has no real order-execution layer. A positive simulated price total isn’t proof of net trading profit, and these screenshots don’t establish account drawdown. Even an exit labeled break-even refers to price movement, not an assurance that trading costs are covered.
Closed-bar decisions mean the indicator waits for a finished candle before accepting its close. They don’t make every fresh calculation identical. Reloading, revised history, a different replay start or different EMA initialization can change the result. Pivot levels also need their right-hand confirmation bars before they appear. A line drawn back to an earlier pivot doesn’t mean the level was known at that earlier moment.
The MT5 port uses MT5’s EMA calculation, chart objects, blended zone colors, panel and notification functions. It preserves the core rules, but exact Pine/MT5 parity on matched feeds hasn’t been established. Use separate charts if you want multiple copies: this build shares the ECX_ object prefix.
Source, Licence and Distribution
- Rights
- Open source
- MT5 port by
- Eko Martha Kusumah (AlgoToolbox)
- Original author
- mdwaseemklk / Waseem Mohammad
- Original work
- EMA Cross Trend Entries [5 TP + SL + Key Levels]
- Licence
- MPL-2.0
- Version tested
- 1.00
- Tool type
- Indicator
Attribution. EMA Cross Trend Entries [5 TP + SL + Key Levels] by , licensed under MPL-2.0. MT5 port by Eko Martha Kusumah: rewritten and tested in MQL5, published on AlgoToolbox. MT5 port source code on GitHub.
Frequently asked questions
Does EMA Cross 5TP trade automatically?
No. Its arrows, stops and targets belong to an internal simulation. The indicator sends no orders to your broker and doesn’t manage a live position.
Does TP1 mean part of the position was closed?
No. It means the first milestone was reached. The simulated position stays open until an exit rule closes it.
Why is the win rate lower on M15 despite more TP1 hits?
Because a TP1 touch isn’t what the panel counts as a win. It counts positive final price outcomes, and 56 M15 trades ended at break-even in this snapshot. The charts cover different calendar spans, too, so this isn’t a universal rule about M15.
Are the $10–$50 targets account-profit amounts?
No. They’re price distances on the chart. Account profit depends on trade volume, contract specifications, currency conversion and execution costs.
Can I shorten the targets or disable EMA exits?
Yes. Save the defaults first, then change one thing and compare over a consistent period. Shorter targets or different exits make a different experiment; they don’t automatically make a better one.
Try it on a chart and follow a few setups from signal to exit. Does the plan behave the way you expected? That’s a better place to begin than the win-rate number alone. You can find our other ports and original tools in Our Builds.
Original strategy and MT5 adaptation
Original publication: EMA Cross Trend Entries [5 TP + SL + Key Levels], by mdwaseemklk / Waseem Mohammad, Pine Script v6. MT5 adaptation: AlgoToolbox, version 1.00, under MPL-2.0. The original source says it was based on EMA_Cross_13_21_EA (MT5); we preserve that note without attributing the earlier EA to an unverified author. No endorsement by the original publisher is implied.
Risk & Transparency Notice: All indicators, Expert Advisors, and Strategy Tester runs on AlgoToolbox are for educational and evaluation purposes only. Trading Forex and CFDs carries substantial financial risk, and backtest results do not guarantee live performance. Read our full Risk Disclaimer.