Strong Recovery Zones MT5 Port
Strong Recovery Zones MT5 Port maps demand, supply and recovery events, with zone scores and EA buffers for chart study, not automated trading.
Strong Recovery Zones MT5 Port gives a chart plenty of ways to look convincing: a bright box, a score of seven and a percentage beside the label. It’s tempting to count those as three votes for a trade. They aren’t voting on the same question. The zone score describes the location. Recovery labels record what happened during a test. Simulated percentages estimate whether price paths reach a boundary. None is a measured chance of making money, and adding them together doesn’t produce one.
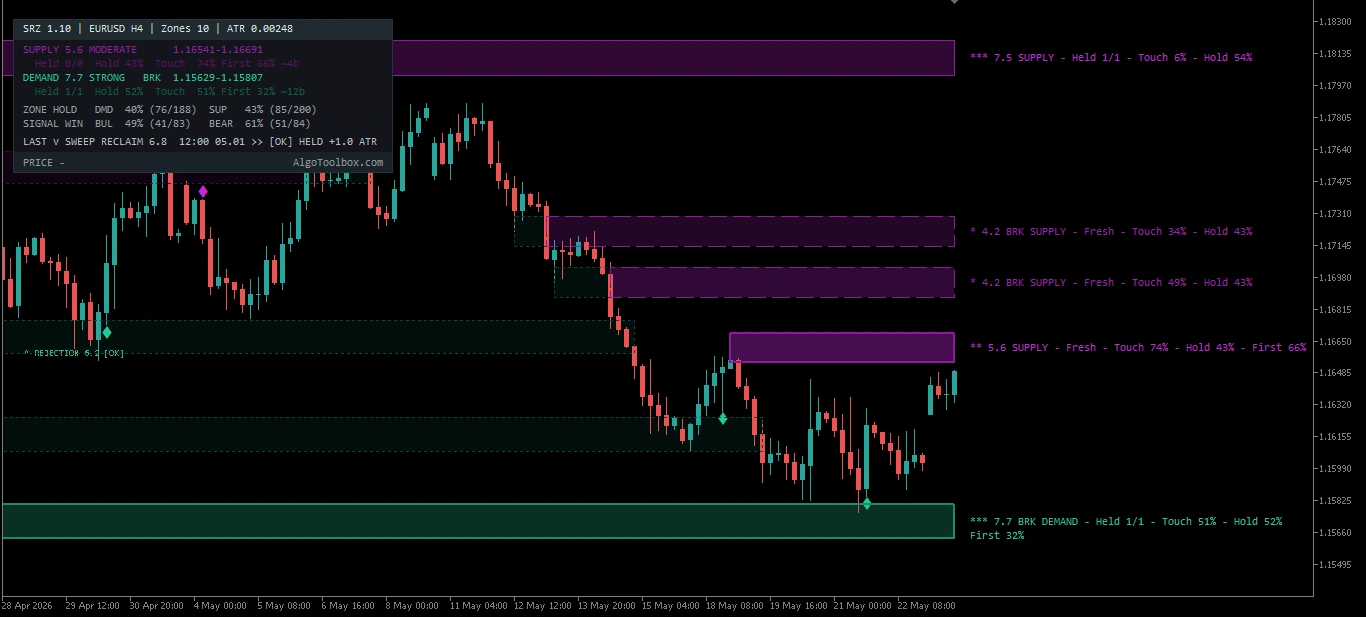
We adapted ProjectSyndicate’s study for MT5 with zone scoring, recovery labels, a summary panel and ten declared buffers. This version 1.10 guide uses XAUUSD H1 and EURUSD, USDJPY and BTCUSD H4 examples to explain HELD, TESTING, STALLED and BROKEN. It doesn’t place orders or size positions. The walkthrough comes first; the complete input reference and diagnostic EA example follow below.
On this page12 sections
Test Bench
| Specification | Our configuration |
|---|---|
| Platform | MetaTrader 5 |
| Tool type | Indicator |
| Version tested | 1.10 |
| Symbol / timeframe | XAUUSD / EURUSD / USDJPY / BTCUSD XAUUSD H1; EURUSD / USDJPY / BTCUSD H4 |
| Test period | Not applicable — indicator walkthrough |
| Data / tick mode | Indicator calculation checks and chart examples: XAUUSD H1; EURUSD, USDJPY and BTCUSD H4 |
| Account & spread | Not recorded for these chart examples |
What It Is and Where It Comes From
We adapted Strong Recovery Zones | ProjectSyndicate, an open-source Pine v6 study, into native MQL5. The original and covered MT5 source retain MPL-2.0 terms. Original authorship remains with ProjectSyndicate.
The port combines demand/supply zones, historical recovery records and model-based reach estimates. Use it to organize manual chart analysis or investigate zone context for an EA. Turning a signal into an executable plan remains a separate job. Related tools are in Our Builds and the indicator collection.
Chart Examples Across Four Markets
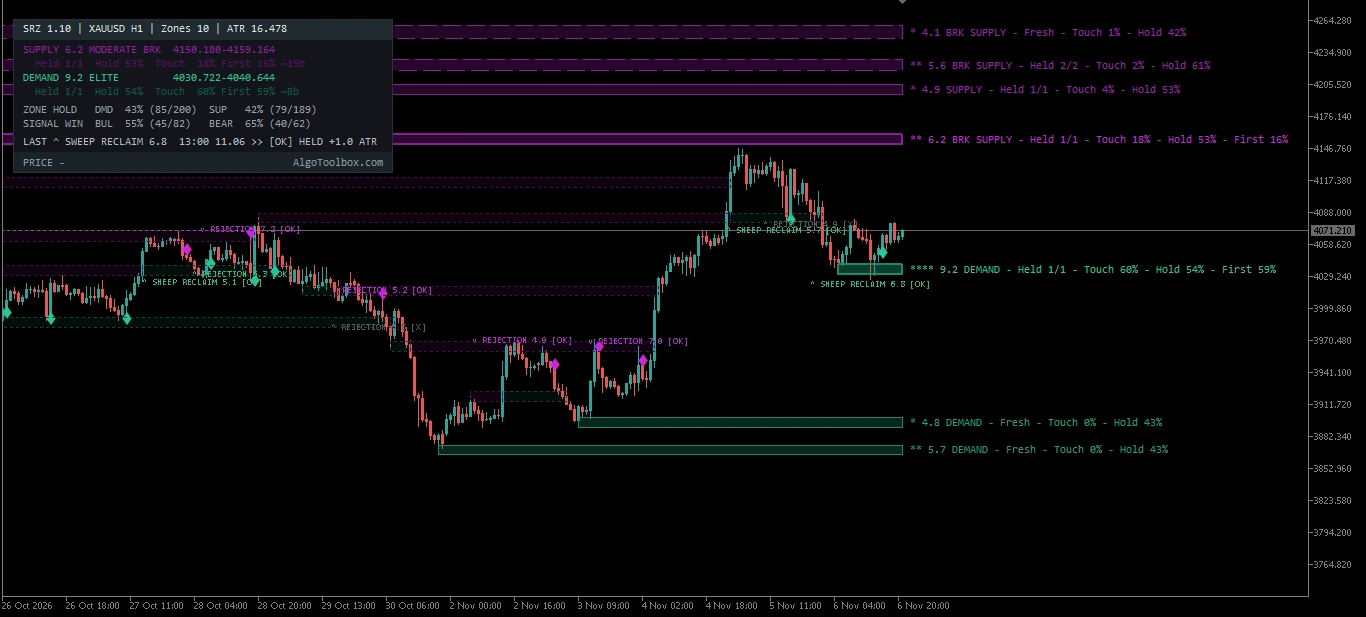
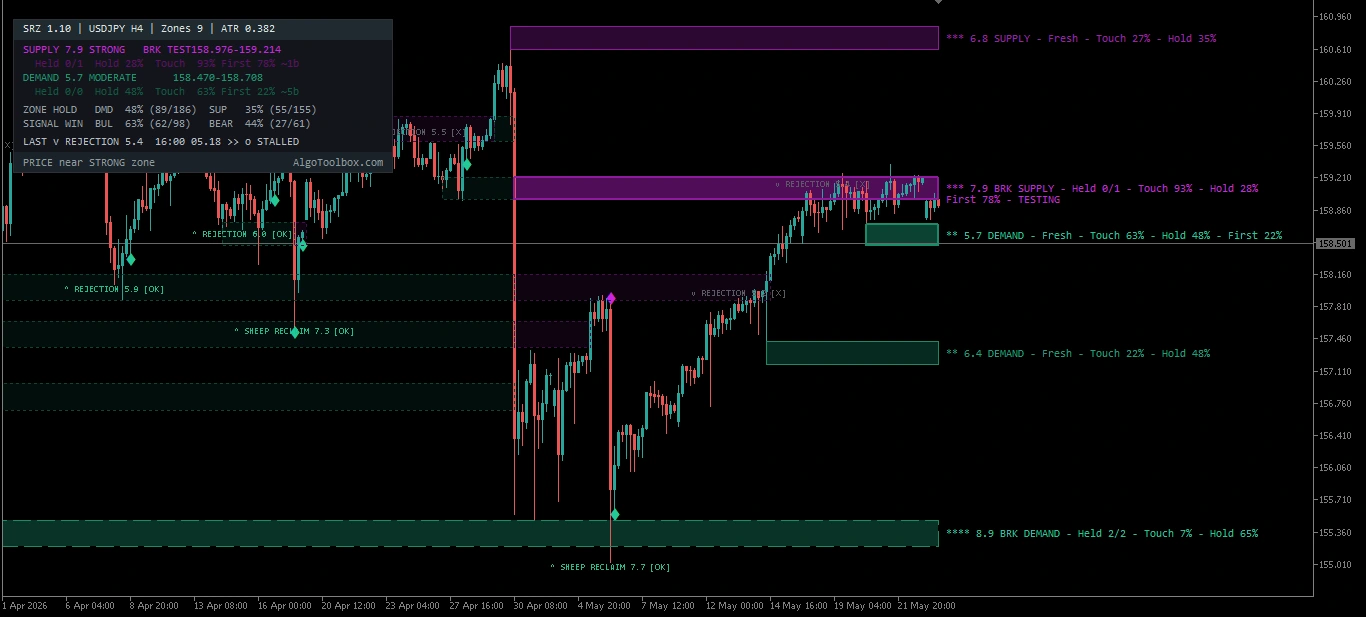
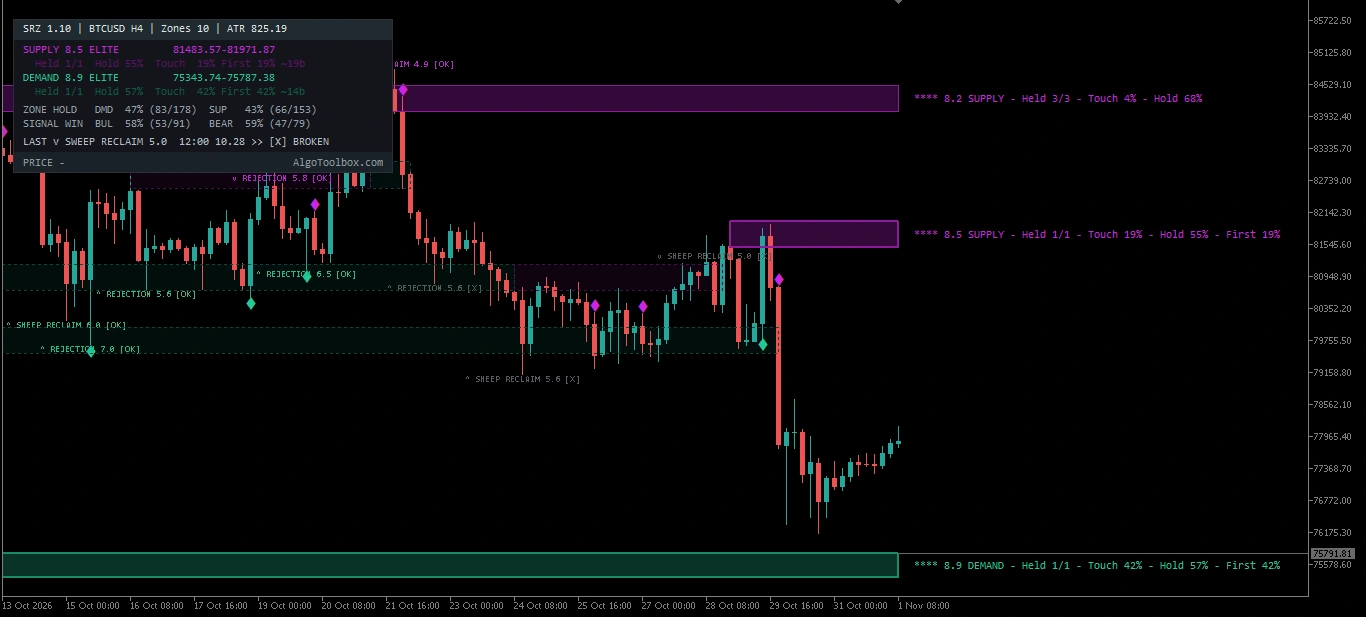
These charts illustrate states, not a contest between markets. Gold shows a held recovery, USDJPY an active test alongside a previously stalled rejection, and Bitcoin a broken recovery. Those are outcomes under the indicator’s rules, not records of entries, profits or account drawdown.
How It Generates Signals
Confirmed pivots supply candidate zones. Defaults require ten candles to the left and three to the right, so a zone becomes available only after those three later bars complete. A box starting at the older pivot can make that delay easy to forget.
The default volume gate requires rank 25 or higher over a 100-value window. It ranks a three-bar volume sum, not just volume on the pivot candle.
ATR normalizes zone size and distances. Defaults use a 0.6-ATR zone height and ATR period 200. Nearby same-side pivots can merge as confluence. A close beyond the far border by the configured tolerance can break a zone, with optional flipping into a breaker.
Demand/supply scores weight volume, departure, defense and confluence, with optional decay while a zone is ignored. The test engine separately checks whether price achieves a recovery, stalls or breaks the zone. Its defaults are a 1.0-ATR recovery target and twenty-bar test window.
Sweep reclaims and rejections feed signal scoring. A signal must meet both zone and signal-score thresholds. Requiring an RSI extreme is optional and off by default.
ZONE HOLD and SIGNAL WIN are internal resolution rates. Neither includes fills, spread, commission, slippage or sizing. Hold % blends a zone’s own record toward the same-side overall hold rate using holdPrior, default four. It isn’t an independent forecast of trade success.
Touch % asks how many simulated paths reach a zone within the chosen horizon. First % compares which focus demand/supply boundary gets reached first. Paths reaching neither can leave the two First percentages totaling less than 100%.
These estimates aren’t a target-before-stop calculation. Defaults use 1,000 paths over thirty bars, sampling 300 recent log returns with drift removed. Read them as answers from that model, under those assumptions.
How to Trade It: Two Approaches
The framework below is for evaluation, not a backtested strategy. It connects a location, a qualifying event and a possible execution plan. The stop, target and timing still need to work without borrowing confidence from a percentage label.
1. Trade the Recovery — the Core Thesis
Start by screening for zone score seven or higher, then compare Hold % with the same-side average. Seven is the screening choice for this walkthrough—not the default entry requirement. Default signal eligibility begins at zone score five and signal score 4.5.
Review Touch % and First % under a fixed horizon, then wait for SWEEP RECLAIM or REJECTION in the zone’s direction. Price arriving at the box isn’t that event.
The confirmed signal close can be an entry reference; an actual fill must come at an available price afterward. Define invalidation beyond the sweep extreme or far zone border, allowing for execution and broker restrictions. The indicator’s break tolerance uses an ATR-based closing-price condition, not the intrabar trigger of a broker stop.
HELD also needs careful timing. Its threshold is a close at least recAtr × current ATR beyond the near border: above demand’s top or below supply’s bottom. Default recAtr is one. Because ATR changes, this isn’t a target fixed at signal time.
A signal can even be confirmed and resolved HELD on the same completed bar. Entering at that close doesn’t let you collect a move that already happened. If price is beyond the recovery threshold when the signal appears, that threshold supplies no remaining reward distance.
Choose a separate stop and target before entry, and inspect the next opposing zone. A wick reaching the recovery threshold alone doesn’t meet the engine’s close-based HELD rule.
STALLED means the zone test reached its age limit without a qualifying recovery or break. Its default twenty bars run from the test’s start, which can precede the signal. That isn’t automatically twenty bars of trade holding time. Define any time exit separately; a visible box isn’t a reason to keep extending it.
2. Stand Down — the Map Says Wait
- The zone broke: stop treating it as intact. If breaker flipping is enabled, study a retest and require a fresh qualifying setup.
- Weak score or Hold % below 50%: skip it under this framework. Fifty percent is a discretionary screen, not a trading break-even threshold.
- Price is near the zone, without a signal: proximity isn’t recovery confirmation.
- Low Touch %: few simulated paths reach it within the selected horizon. Leave it on the map while giving more relevant zones your attention.
The working idea is a strong zone, a favorable hold record relative to its side and a qualifying recovery event, evaluated toward the next opposing zone. Weak records, breaks, low modeled reach or no signal favor waiting. Choose Touch % and First % cutoffs before reviewing results, then keep them consistent.
What We Checked
We inspected the public v1.10 source: 115 input declarations, ten buffers, the processing loop, volume fallback and simulation rules. The four charts show the notation in use. This revision adds no independent compilation, terminal replay, alert-delivery test or EA integration result. Our testing framework explains the broader approach.
The discretionary framework hasn’t been strategy-backtested. No return or account-drawdown figures are reported, and matched-feed Pine parity remains unestablished. Record fills, exits, sizing and costs separately from event counts. Overlapping tests of related zones aren’t necessarily independent market decisions.
Limitations and When to Turn It Off
Use rightBars to establish when a zone became available. At default three, start assessing it after three right-hand candles confirm the pivot—not at the box’s earlier anchor. Keep history consistent across comparisons because available bars affect reconstructed state.
The volume rank is feed-dependent. Each bar uses positive real volume where available, otherwise tick volume. A broker change can therefore alter qualifying pivots. For simulation comparisons, hold return sample, horizon, drift, paths and seed constant. MT5’s random generator differs from Pine’s, so identical percentages aren’t promised.
Compressed charts can crowd labels together. Add right-hand Chart Shift space, show fewer zones or simplify labels. Use one copy per chart: instances share the SRZ_ prefix and can interfere with drawing and cleanup.
If interaction becomes sluggish, reduce history or simulation work. Leave mcTick off unless tick-by-tick estimates are needed. Popup and push default off even though several event toggles are on. Enable only useful alerts, and stop relying on output when data is incomplete, labels unreadable or the calculation state unclear.
Installation
- Use the product Download button for
StrongRecoveryZones.zipon Google Drive. Extract the indicator and preset files. - Open File → Open Data Folder in MT5. Copy
StrongRecoveryZones.ex5intoMQL5/Indicators/. To build the included source, openStrongRecoveryZones.mq5in MetaEditor, press F7 and resolve errors before attaching it. - Refresh Navigator or restart MT5. Attach one instance with sufficient history. Keep the PascalCase filename for the diagnostic example below.
- Load a
.setunder Inputs, inspect its values and enable Chart Shift for labels. A preset is a parameter file, not an automated trading system. - Compare closed-bar labels with source rules on demo. Check event switches and terminal notification setup before enabling popup or push.
What Changed in Our MT5 Port
The port uses native rectangles, labels, arrow plots and segmented trend lines. Transparency is approximated by blending toward the background. The forecast cone uses line segments rather than a filled Pine polygon. Some Unicode symbols become ASCII labels, and the optional nine-row panel adds MT5-specific presentation.
Per-bar volume falls back from positive real volume to tick volume. Monte Carlo paths use a seeded 32-bit linear congruential generator, not Pine’s random implementation. A reproducible seed within this build doesn’t establish numerical identity across platforms.
A default 5,000-bar initial-processing guard limits loading work. Changing it or the available history can change reconstructed zones.
EA Integration: iCustom Buffers
For the example, keep StrongRecoveryZones.ex5 in MQL5/Indicators/. Events use closed bars; shift 1 is the latest completed candle. Buffers 0–1 plot hold events. Buffers 2–9 are internal calculation buffers, so the declared map isn’t validated external access. The diagnostic below hasn’t been compile- or runtime-tested.
| Buffer | Identifier | Meaning |
|---|---|---|
| 0 | bufHoldB | Demand hold diamond; EMPTY_VALUE when absent. |
| 1 | bufHoldR | Supply hold diamond; EMPTY_VALUE when absent. |
| 2 | bufSigDir | +1 bullish, −1 bearish, 0 none. |
| 3 | bufSigSc | Signal score 0–10; 0 when idle. |
| Buffer | Identifier | Meaning |
|---|---|---|
| 4 | bufDemTop | Focus demand upper boundary. |
| 5 | bufDemBot | Focus demand lower boundary. |
| 6 | bufDemSc | Focus demand score, 0–10. |
| 7 | bufSupTop | Focus supply upper boundary. |
| 8 | bufSupBot | Focus supply lower boundary. |
| 9 | bufSupSc | Focus supply score, 0–10. |
Zone values are zero when no focus zone qualifies. Buffers 4–9 don’t necessarily identify the zone that produced a signal. With multiple events on one bar, direction comes from the last encountered event while score retains the highest value. The direction, score and focus zone can therefore refer to different events.
showHeld controls population of buffers 0–1. Visual labels and panel switches don’t disable calculations in 2–9. Hold %, Touch % and First % aren’t historical output buffers.
Explicit iCustom arguments must follow declaration order and types. Group headings aren’t string arguments, and loading a chart .set doesn’t configure a separate iCustom handle.
// Diagnostic EA example: prints once per closed bar; places no orders.
int handle = INVALID_HANDLE;
datetime lastRead = 0;
int OnInit()
{
   handle = iCustom(_Symbol, PERIOD_CURRENT, "StrongRecoveryZones");
   if(handle == INVALID_HANDLE) return INIT_FAILED;
   return INIT_SUCCEEDED;
}
void OnTick()
{
   datetime closed = iTime(_Symbol, PERIOD_CURRENT, 1);
   if(closed == 0 || closed == lastRead) return;
   if(BarsCalculated(handle) < 2) return;
   double direction[1], score[1];
   if(CopyBuffer(handle, 2, 1, 1, direction) != 1) return;
   if(CopyBuffer(handle, 3, 1, 1, score) != 1) return;
   lastRead = closed;
   if(direction[0] != 0.0)
      PrintFormat("SRZ closed-bar direction %.0f; score %.1f",
                  direction[0], score[0]);
}
void OnDeinit(const int reason)
{
   if(handle != INVALID_HANDLE) IndicatorRelease(handle);
}
This diagnostic places no orders. Check compilation, readiness and actual reads before extending it. A valid handle alone isn’t integration validation. See the official iCustom documentation and CopyBuffer reference.
Inputs and Defaults
The source declares 115 inputs in ten groups. The reference below retains declaration order, source types and literal defaults—not a claim that every chart used all defaults. Colors are RGB and enum values use source identifiers. Informational URLs don’t change calculations.
Zones
| Input | Type | Default | Purpose |
|---|---|---|---|
sideMode |
ENUM_SIDE | SIDE_BOTH |
Zone Side |
leftBars |
int | 10 |
Pivot Left (2..50) |
rightBars |
int | 3 |
Pivot Right (1..20) |
minVolStr |
int | 25 |
Min Pivot Volume Rank (%) (0 = off) |
volHiLen |
int | 100 |
Volume Rank Window |
heightMode |
ENUM_HEIGHT | HM_NORM_ATR |
Zone Height |
heightAtr |
double | 0.6 |
Normalized Height (ATR) |
minHAtr |
double | 0.3 |
Band Min Height (ATR) |
maxHAtr |
double | 1.0 |
Band Max Height (ATR) |
atrLen |
int | 200 |
ATR Length |
lookbackBars |
int | 3000 |
Lookback (bars, 0 = all) |
maxBarsBack |
int | 5000 |
Max Bars Processed At Load (performance guard, 0 = all) |
maxZones |
int | 40 |
Max Live Zones |
maxLife |
int | 1000 |
Max Zone Life (bars) |
mergeAtr |
double | 1.0 |
Min Zone Spacing (ATR) – closer same-side pivots merge as confluence |
breakTol |
double | 0.2 |
Break Tolerance (ATR) – a close this far beyond the far border breaks the zone |
flipBroken |
bool | true |
Flip Broken Zones Into Breakers |
showHist |
bool | true |
Keep Broken Zones As History |
maxHist |
int | 20 |
Max History Zones |
Test & Recovery Engine
| Input | Type | Default | Purpose |
|---|---|---|---|
recAtr |
double | 1.0 |
Recovery Target (ATR beyond zone) – a test is HELD on a close this far past the near border |
testWin |
int | 20 |
Test Window (bars) |
sweepAtr |
double | 0.15 |
Sweep Depth (ATR beyond far border) |
reclaimDpt |
ENUM_RECL | RC_FAR |
Sweep Reclaim Close |
wickMin |
double | 0.4 |
Rejection Wick Min (of bar range) |
useRsi |
bool | false |
Require RSI Extreme For Signals |
rsiLen |
int | 14 |
RSI Length |
rsiWin |
int | 8 |
RSI Extreme Window |
rsiOs |
int | 40 |
RSI Oversold <= |
rsiOb |
int | 60 |
RSI Overbought >= |
Zone Score (0-10)
| Input | Type | Default | Purpose |
|---|---|---|---|
minScore |
double | 0.0 |
Min Score To Display |
strongThr |
double | 7.0 |
Strong Zone Threshold |
wVol |
double | 0.30 |
Weight – Pivot Volume |
wDep |
double | 0.30 |
Weight – Departure |
wDef |
double | 0.25 |
Weight – Defense Record |
wSwp |
double | 0.15 |
Weight – Confluence & Sweeps |
sweepNorm |
double | 2.0 |
Confluences + Reclaims For Full Credit |
useDecay |
bool | true |
Decay While Ignored |
decayBars |
int | 400 |
Full Decay Over (idle bars) |
decayFloor |
double | 0.7 |
Decay Floor |
Signal Score (0-10)
| Input | Type | Default | Purpose |
|---|---|---|---|
sigMinScore |
double | 4.5 |
Min Signal Score |
sigZoneMin |
double | 5.0 |
Min Zone Score For Signals |
sigStrong |
double | 7.0 |
Strong Signal Threshold |
volLen |
int | 20 |
Volume Baseline Length |
depthRef |
double | 1.0 |
Grab Depth Ref (ATR) |
dispRef |
double | 1.0 |
Reclaim Displacement Ref (ATR) |
volRef |
double | 2.0 |
Volume Surge Ref (x) |
twDepth |
double | 1.0 |
Weight – Grab Depth |
twWick |
double | 1.0 |
Weight – Rejection Wick |
twVol |
double | 1.0 |
Weight – Volume Surge |
twBase |
double | 1.0 |
Weight – Zone Score |
twDisp |
double | 1.0 |
Weight – Displacement |
twSpeed |
double | 1.0 |
Weight – Speed |
Probability Engine
| Input | Type | Default | Purpose |
|---|---|---|---|
probOn |
bool | true |
Enable Monte Carlo Probabilities |
mcModel |
ENUM_MCM | MC_HIST |
Return Model |
mcPaths |
int | 1000 |
Paths (100..3000) |
mcHz |
int | 30 |
Horizon (bars) |
mcSample |
int | 300 |
Return Sample (bars) |
mcDrift |
bool | false |
Keep Drift |
mcSeed |
int | 7 |
Random Seed |
mcTick |
bool | false |
Update On Every Tick (off = confirmed bars only) |
holdPrior |
double | 4.0 |
Hold Estimate Prior Strength |
showCone |
bool | false |
Show Forecast Cone |
coneLo |
int | 10 |
Cone Lower Percentile |
coneHi |
int | 90 |
Cone Upper Percentile |
AlgoToolbox – Guide, Presets & EA Buffers
| Input | Type | Default | Purpose |
|---|---|---|---|
lnkGuide |
string | "https://algotoolbox.com/products/strong-recovery-zones-mt5/" |
Full Guide & .set Presets |
lnkInputs |
string | "https://algotoolbox.com/products/strong-recovery-zones-mt5/#inputs-and-defaults" |
All Inputs & Symbol Settings |
lnkBuffers |
string | "https://algotoolbox.com/products/strong-recovery-zones-mt5/#icustom-buffers" |
EA iCustom Buffers (0-9) |
lnkLimits |
string | "https://algotoolbox.com/products/strong-recovery-zones-mt5/#limitations-and-when-to-turn-it-off" |
MT5 Notes & Known Limits |
lnkYt |
string | "https://www.youtube.com/@AlgoToolbox-mt5" |
YouTube |
lnkTg |
string | "https://t.me/algotoolbox" |
Telegram |
lnkSrc |
string | "Original Pine v6: Strong Recovery Zones by ProjectSyndicate (MPL-2.0)" |
Credits |
Labels & Signals
| Input | Type | Default | Purpose |
|---|---|---|---|
labMode |
ENUM_LABM | LM_COMPACT |
Zone Labels |
showPerSide |
int | 4 |
Zones Shown Per Side (0 = all) |
labSize |
ENUM_SZ | SZ_SMALL |
Label Size |
labOff |
int | 2 |
Label Offset (bars right) |
labGapPct |
double | 4.5 |
Label Spacing (% of recent range) |
showSig |
bool | true |
Show Recovery Signals |
maxSigs |
int | 10 |
Max Signals Drawn |
sigSize |
ENUM_SZ | SZ_TINY |
Signal Size |
showHeld |
bool | true |
Mark Confirmed Holds (diamond) |
Style
| Input | Type | Default | Purpose |
|---|---|---|---|
bullCol |
color | C'33,201,151' |
Demand Tone |
bearCol |
color | C'204,36,226' |
Supply Tone |
coneCol |
color | C'140,147,168' |
Cone Tone |
fillTransp |
int | 72 |
Strong Zone Transparency (blend toward background) |
weakTransp |
int | 90 |
Weak Zone Transparency |
showBord |
bool | true |
Show Zone Borders |
bordTransp |
int | 30 |
Border Transparency |
histTransp |
int | 93 |
History Zone Transparency |
glowOn |
bool | true |
Brighten Zones Near Price |
glowRange |
double | 2.5 |
Glow Range (ATR) |
glowBoost |
int | 16 |
Glow Strength |
fontName |
string | "Consolas" |
Label font |
Panel
| Input | Type | Default | Purpose |
|---|---|---|---|
panelOn |
bool | true |
Show info panel (top-left) |
panelX |
int | 10 |
Panel X offset |
panelY |
int | 20 |
Panel Y offset |
panelFont |
int | 8 |
Panel font size |
panelCol |
color | C'200,204,214' |
Panel text colour |
panelBgOn |
bool | true |
Panel dark background |
panelBg |
color | C'19,21,27' |
Panel background colour |
panelHdBg |
color | C'32,42,48' |
Header band colour |
panelFtBg |
color | C'27,34,41' |
Footer band colour |
panelW |
int | 380 |
Panel width (px) |
Alerts
| Input | Type | Default | Purpose |
|---|---|---|---|
proxPct |
double | 0.10 |
Proximity (% of price) |
alertsOn |
bool | false |
Terminal alerts (popup) on events |
pushOn |
bool | false |
Push notifications on events |
dynAlerts |
bool | true |
Detailed signal message on every recovery signal |
alNewZone |
bool | false |
Alert – New Recovery Zone |
alTest |
bool | false |
Alert – Zone Test |
alSweep |
bool | true |
Alert – Zone Sweep |
alSignal |
bool | true |
Alert – Recovery Signal (bull/bear) |
alStrong |
bool | true |
Alert – Strong Recovery Signal |
alHeld |
bool | false |
Alert – Hold Confirmed |
alBreak |
bool | true |
Alert – Zone Broken / Flipped |
alNear |
bool | true |
Alert – Approaching Zone (once per zone) |
alNearStrong |
bool | true |
Alert – Approaching Strong Zone (once per zone) |
Enum Options
ENUM_SIDE: SIDE_BOTH=0, SIDE_DEMAND=1, SIDE_SUPPLY=2ENUM_HEIGHT: HM_NORM_ATR=0, HM_VOL_WICK=1ENUM_RECL: RC_FAR=0, RC_MID=1, RC_NEAR=2ENUM_MCM: MC_HIST=0, MC_GAUSS=1ENUM_LABM: LM_COMPACT=0, LM_DETAILED=1, LM_FULL=2, LM_OFF=3ENUM_SZ: SZ_TINY=0, SZ_SMALL=1, SZ_NORMAL=2, SZ_LARGE=3
Symbol Profiles and Presets
The documented profiles are XAUUSD M15–H1, XAUUSD M5 strict and FX M15 without the volume gate. They’re starting configurations, not established optimal settings. Load one, then inspect the actual volume gate, thresholds and history limits rather than trusting its name. This revision hasn’t independently rechecked the Drive archive or EX5/source correspondence.
For a first comparison, hold symbol, timeframe, history depth and seed constant, then change one setting. Get the labels readable and the zone count manageable before adding simulation work. Disabling the volume gate changes eligible pivots; it isn’t a cosmetic adjustment.
Source, Licence and Distribution
- Rights
- Open source
- MT5 port by
- Eko Martha Kusumah (AlgoToolbox)
- Original author
- ProjectSyndicate
- Original work
- Strong Recovery Zones | ProjectSyndicate
- Licence
- MPL-2.0
- Version tested
- 1.10
- Tool type
- Indicator
Attribution. Strong Recovery Zones | ProjectSyndicate by , licensed under MPL-2.0. MT5 port by Eko Martha Kusumah: rewritten and tested in MQL5, published on AlgoToolbox. MT5 port source code on GitHub.
Frequently Asked Questions
Does the Strong Recovery Zones MT5 port trade automatically?
No. It draws zones and events and exposes buffers. The diagnostic EA prints readings without placing orders. Execution and account risk need separate rules.
Is SIGNAL WIN a strategy win rate?
No. It counts outcomes under the internal signal-resolution rules. It doesn’t include an executable entry/exit plan, trading costs or position sizing.
Which candle should an EA read?
The example requests shift 1, the latest completed candle. Check readiness, CopyBuffer return counts and actual values in the terminal. Buffers 2–9 and the example haven’t been runtime-tested here. Also retain the caveat that multiple events can leave direction, score and focus zone referring to different events.
Which preset should you start with?
The documented starting points are XAUUSD M15–H1 for gold in that range, XAUUSD M5 strict for five-minute gold, and FX M15 no volume gate for that Forex comparison. Inspect the loaded thresholds and history settings. A chart preset doesn’t automatically configure a separate iCustom handle.
Final Verdict
We like Strong Recovery Zones for following a location through its test: when the zone became available, what triggered and how it later resolved. Keep zone score, signal score and simulated reach percentages separate. They’re useful answers to different questions, not ingredients for a trading win probability.
Start with one chart and a recorded baseline. Check confirmation timing, volume source and the actual signal bar before reading the history. Keep execution and cash risk in a separate plan, and validate alerts or buffer access before relying on them. A recovery label can explain what happened without leaving a trade you could still enter.
Risk & Transparency Notice: All indicators, Expert Advisors, and Strategy Tester runs on AlgoToolbox are for educational and evaluation purposes only. Trading Forex and CFDs carries substantial financial risk, and backtest results do not guarantee live performance. Read our full Risk Disclaimer.