Absorption Radar MT5 Port
Absorption Radar MT5 Port maps volume-spike wick rejections, range sweeps and ATR reference levels on XAUUSD H1 and M30 without executing trades.
The Absorption Radar MT5 port adapts volume-spike wick rejection, range-sweep markers and ATR-based reference levels for MetaTrader 5 charts. We rebuilt the indicator in native MQL5 using ten plot and level buffers, chart rectangles and a closed-bar status dashboard. It remains a visual chart-study tool whose Entry, SL and TP lines never send broker orders or size positions.
This page documents version 1.00 against the published MQL5 source and our XAUUSD H1 and M30 chart captures. Both target ladders match their configured 1R, 2R and 3R risk multiples to within one-thousandth of a point. That check confirms level arithmetic and display state, not strategy profitability or bar-by-bar parity with TradingView.
Test Bench
| Specification | Our configuration |
|---|---|
| Platform | MetaTrader 5 |
| Tool type | Indicator |
| Version tested | 1.00 |
| Symbol / timeframe | XAUUSD H1 / M30 |
| Data / tick mode | Supplied XAUUSD H1/M30 chart captures and static MQL5 source/level checks; not a strategy backtest |
What Absorption Radar Is and Where It Comes From
We built this MetaTrader 5 adaptation from Smart Money Absorption Radar [Thomas], an open-source Pine Script v6 indicator published by Thomas-Sterling under Mozilla Public License 2.0. The concept looks for candles where elevated volume meets a long rejection wick, suggesting passive limit orders absorbed aggressive market flow near a local extreme.
Our build is an independent adaptation and is neither endorsed by Thomas-Sterling nor connected to any external signal channel. It serves discretionary traders and MQL5 developers who want volume-backed rejection zones, range-sweep triangles and ATR reference ladders plotted directly on MT5 charts. Displayed targets mark static price distances from the signal close rather than filled trades.
How It Generates Signals
Combine relative volume spikes with wick rejection
Every completed candle is tested against a simple moving average of the previous twenty bars of volume, excluding the bar under evaluation. At the default 1.5 multiplier, volume must reach at least one and a half times that twenty-bar baseline to qualify as a spike. On calm sessions without a qualifying spike, wick geometry alone never triggers an absorption signal.
When volume qualifies, the engine checks candle proportions across total high-to-low range. Buyer absorption requires a lower wick covering at least forty percent of total candle range alongside a close in the top forty percent of the bar. Seller absorption mirrors that test, demanding an upper wick of at least forty percent and a close inside the bottom forty percent.
Apply optional sweep, trend and shared cooldown gates
Alongside absorption candles, the indicator scans the prior twenty completed bars for liquidity sweeps. A bullish sweep prints when price trades below the twenty-bar range low and closes back above it; a bearish sweep breaks the twenty-bar high and closes back below. By default, sweep triangles appear on the chart without restricting absorption arrows unless the sweep filter is enabled.
Two additional gates control signal frequency on fast intraday feeds. Enabling the EMA trend filter requires buyer absorption to close above the 200-period exponential moving average and seller absorption to close below it. An eight-bar cooldown timer is shared across both directions, meaning a qualifying buy suppresses both buy and sell signals for the next eight closed bars.
Project ATR reference ladders on completed bars
Each qualifying signal sets Entry at the signal candle’s closing price and calculates one risk unit from a fourteen-period Average True Range multiplied by 1.5. For a buy setup, the stop reference sits 1.5 ATR below Entry while TP1, TP2 and TP3 project upward at 1.0, 2.0 and 3.0 risk units. Sell setups invert those offsets above and below Entry.
Those five reference prices are stored in indicator buffers five through nine and remain constant on subsequent bars until a newer signal overwrites the active plan. Before the first qualifying event in chart history, those five level buffers hold zero rather than a price coordinate. Any automated reader must treat zero as an empty state rather than a literal quote.
What Changed in Our MT5 Port
Translating Pine Script v6 visuals into MQL5 required replacing TradingView boxes, labels and tables with native chart objects and ten indicator buffers. Buffer zero plots the 200 EMA, buffers one through four carry buy, sell and sweep arrow codes, and buffers five through nine hold carried Entry, SL and TP values for CopyBuffer access. Our MT5 source repository documents the full buffer contract and input declaration order.
Unlike Pine scripts that update dashboard cells intrabar, our port evaluates signals and panel text strictly on completed bars. While a new candle is still forming, the EMA line updates live, whereas the top-left radar panel reports the last closed bar. Keeping only the latest bull zone, bear zone and active target ladder caps steady-state chart clutter near twenty-five objects.
MetaTrader 5 also splits volume into tick counts and exchange-reported real volume, so we added an explicit volume-source selector defaulting to tick volume. Because MQL5 chart rectangles lack per-fill alpha channels on standard object layers, zone fills blend toward the active chart background color using an eighty-seven percent transparency default. Alerts likewise fire strictly once per newly closed bar and ignore historical bars on load.
Inputs and Defaults
The MQL5 source exposes thirty inputs across seven numbered groups: twenty match the published Pine v6 defaults and ten are MT5-specific additions for metadata, tick-versus-real volume selection, background blending and closed-bar notifications. Our XAUUSD H1 Inputs capture matches every source default, including tick volume mode, eighty-seven zone transparency and all alert toggles disabled.
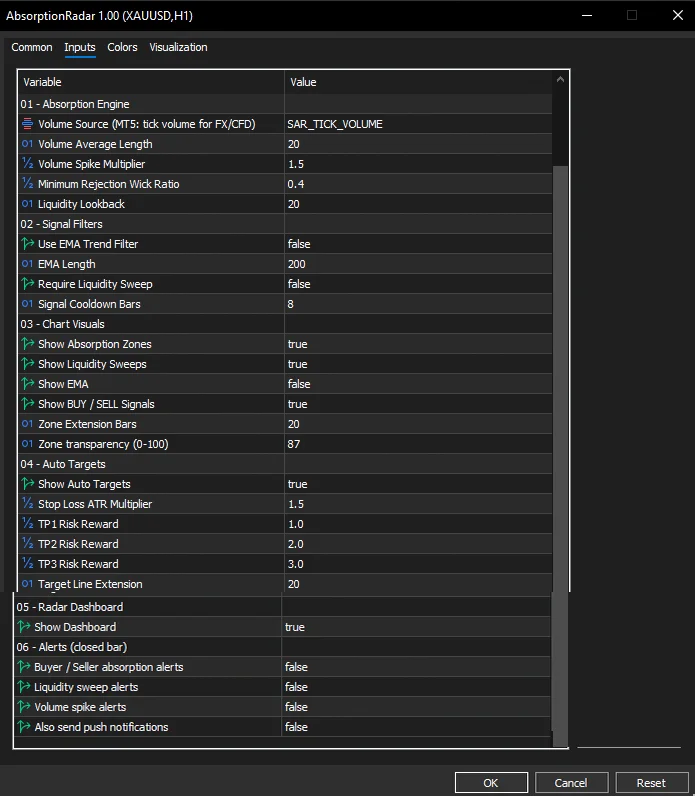
| Input group | Source default | What it controls | MT5 port notes |
|---|---|---|---|
| 00 — About | Credit & project URLs | Read-only attribution, Telegram, homepage and broker strings | Port-only metadata; broker URL is disclosed as an affiliate link |
| 01 — Volume Spike | Tick volume, 20, 1.5x | Volume feed, SMA lookback and minimum spike multiple | Real volume is often zero on FX/CFD feeds, silencing signals |
| 01 — Wick & Sweep Range | 0.40 wick, 20 bars | Minimum rejection wick ratio and range-sweep lookback | Close-position thresholds (0.60 / 0.40) are fixed in source |
| 02 — Trend & Sweep Gates | Off, EMA 200, Off | Optional EMA directional filter and same-bar sweep requirement | EMA buffer fills even when line display or filter stays off |
| 02 — Cooldown | 8 bars | Minimum closed bars required between any two signals | Shared timer across buy and sell setups, not per direction |
| 03 — Chart Visuals | Zones/Sweeps/Signals On, 20, 87 | Object toggles, 20-bar box projection and fill transparency | EMA line starts hidden; zone color blends with chart background |
| 04 — Auto Targets | On, 1.5 ATR, 1 / 2 / 3R, 20 | ATR stop multiplier, three reward multiples and ray length | ATR length is hard-coded to 14 rather than exposed as an input |
| 05–06 — Panel & Alerts | Panel On, all 4 alerts Off | Top-left seven-row dashboard and closed-bar popup/push alerts | Invalid numeric inputs fail initialization with an Experts log message |
How We Checked This Snapshot
Because Absorption Radar is a non-executing chart indicator rather than an automated trading system, a Strategy Tester equity curve does not apply unless you wrap its buffers in separate order-placement rules. Instead, we audited the version 1.00 MQL5 source, release archive hashes and two multi-day XAUUSD chart captures on H1 and M30 to verify level math and state behavior.
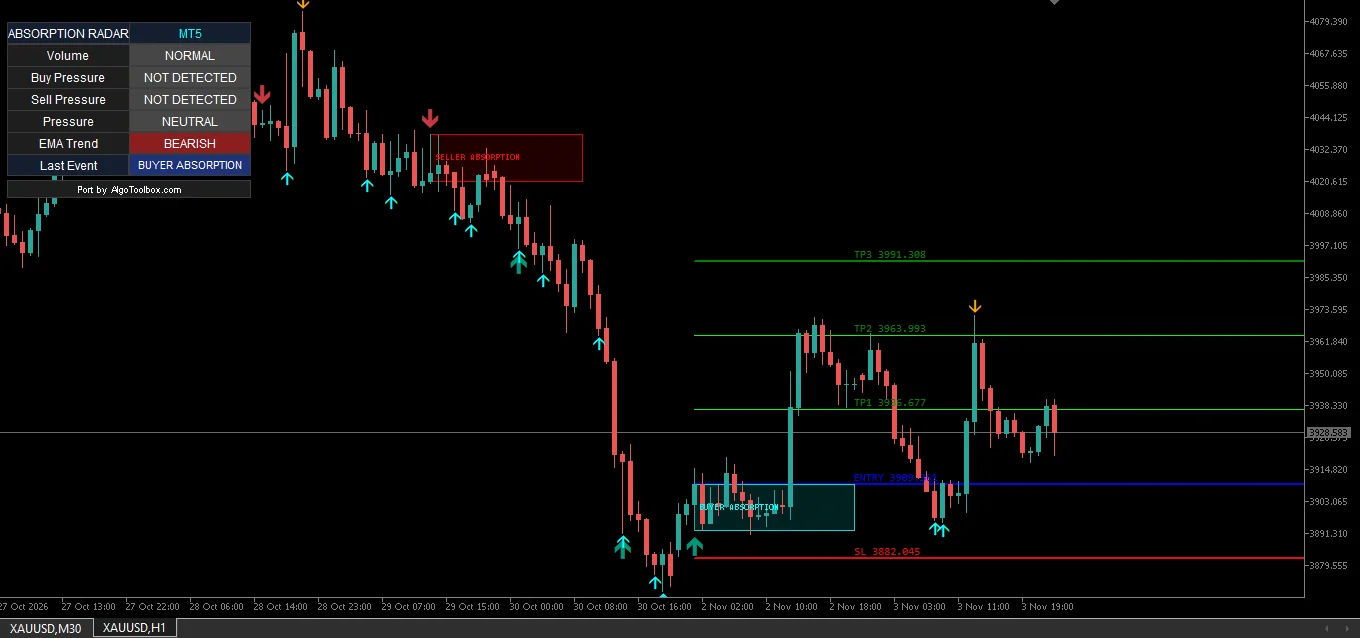
On XAUUSD H1, the active BUY ladder prints Entry at 3,909.361 and SL at 3,882.045, establishing a 1R stop distance of 27.316 points (1.5 times fourteen-period ATR). Adding 1R, 2R and 3R produces 3,936.677, 3,963.993 and 3,991.309, matching the plotted TP1 3,936.677, TP2 3,963.993 and TP3 3,991.308 within a single one-thousandth floating-point rounding step.
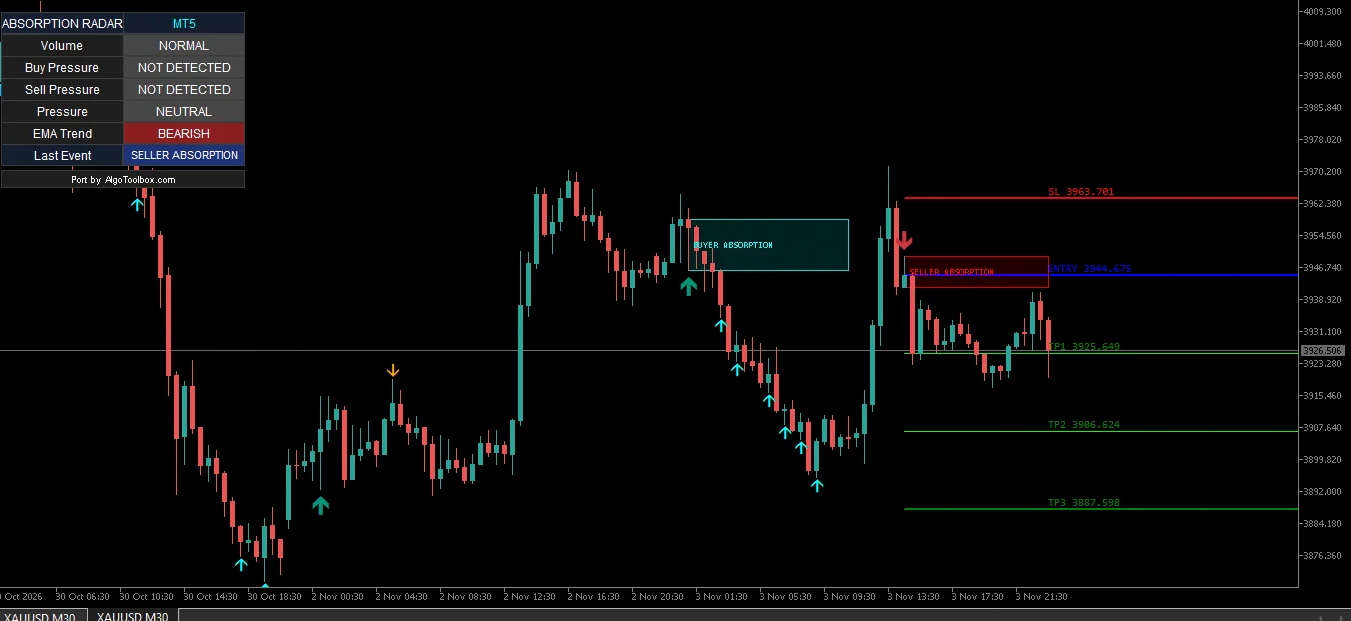
On XAUUSD M30, the active SELL ladder prints Entry at 3,944.675 and SL at 3,963.701 for a 1R distance of 19.026 points. Subtracting 1R, 2R and 3R yields 3,925.649, 3,906.623 and 3,887.597, matching TP1 3,925.649, TP2 3,906.624 and TP3 3,887.598 within 0.001 points. Both captures show Buy and Sell Pressure reading NOT DETECTED while Last Event retains the earlier signal label, confirming pressure cells reflect the latest closed bar whereas Last Event stores signal memory.
| Checked item | XAUUSD H1 capture | XAUUSD M30 capture | Verification note |
|---|---|---|---|
| Active setup & Last Event | BUY / BUYER ABSORPTION | SELL / SELLER ABSORPTION | Matches latest plotted signal arrow on each timeframe |
| Closed-bar dashboard state | Volume NORMAL, EMA BEARISH | Volume NORMAL, EMA BEARISH | Pressure cells read NOT DETECTED on later calm bars by design |
| Entry & Stop Loss (1R) | 3,909.361 / 3,882.045 (27.316) | 3,944.675 / 3,963.701 (19.026) | Equals 1.5x ATR(14) measured at the signal bar close |
| TP1 (1.0R) | 3,936.677 (+27.316) | 3,925.649 (-19.026) | Exact 1.0R match to three decimal places |
| TP2 (2.0R) | 3,963.993 (+54.632) | 3,906.624 (-38.051) | Matches 2.0R within 0.001 float rounding on M30 |
| TP3 (3.0R) | 3,991.308 (+81.947) | 3,887.598 (-57.077) | Matches 3.0R within 0.001 unrounded ATR multiplication |
Limitations and When to Turn It Off
First, we have not audited the original Pine Script source line by line or run matched broker-feed comparisons between TradingView and MetaTrader 5. Two thresholds are hard-coded inside the MQL5 file rather than exposed as inputs: ATR stop calculation always uses period fourteen, and candle close-position tests stay fixed at 0.60 and 0.40. Zone boxes also span from candle body edge to wick tip, which can appear narrower than full-candle boxes.
Second, broker volume feeds directly govern signal generation. Because FX and metals CFDs measure tick-quote updates rather than centralized exchange contracts, two brokers can print different volume spikes on the same XAUUSD hour, and switching the feed input to real volume on CFD symbols typically produces zero signals. Around thin session rollovers or weekend gaps, distorted candle ranges and low tick counts make volume-spike ratios unreliable.
Third, keep visual quirks in mind during live chart work or Expert Advisor integration. Enabling the sweep filter restricts absorption arrows without hiding standalone sweep triangles, and zone captions can overlap nearby target rays, as seen where SELLER ABSORPTION crosses ENTRY on our M30 capture. External EAs reading buffers five through nine must check buffers one or two on bar shift one so carried levels are not mistaken for fresh triggers.
How It Compares
Within our Our Builds catalog, Liquidity Hunter MT5 Port adapts another Thomas-Sterling smart-money concept but triggers very differently. Liquidity Hunter waits for a five-bar confirmed swing pivot, a sweep and a subsequent market-structure break before placing stops at the sweep extreme. Absorption Radar evaluates single-candle volume spikes and wick rejections immediately on bar close and sizes stops from ATR(14).
Traders who focus on three-candle price imbalances rather than wick-and-volume exhaustion may prefer FVG Sniper MT5 Port, which maps fair value gaps without requiring a relative volume surge. Absorption Radar works best when treated as a local exhaustion and sweep filter on liquid intraday charts like XAUUSD rather than a standalone reversal system during one-way macro breakouts.
Installation
Download AbsorptionRadar.zip from GitHub Release 1.00 or pull src/AbsorptionRadar.mq5 from the repository. Note one packaging detail: although the main-branch README and known-issues notes describe the source tree as shipping without a precompiled binary, the published Release 1.00 ZIP archive includes both AbsorptionRadar.ex5 and the matching AbsorptionRadar.mq5 source file. If you have not installed a custom indicator before, follow our step-by-step guide on how to install a custom MT5 indicator from GitHub.
Place either file inside your terminal’s MQL5/Indicators/ folder via File -> Open Data Folder, compile in MetaEditor with F7 if building from source, and refresh the Navigator panel. Attach the indicator to an H1 or M30 chart, keep Volume Source set to Tick Volume on FX and metals CFDs, and confirm that the top-left ABSORPTION RADAR | MT5 panel initializes cleanly without Experts-tab parameter errors.
Advantages and Disadvantages
Its strongest practical traits are non-repainting closed-bar evaluation, full MPL-2.0 source transparency and clean object housekeeping. Keeping only the latest bullish zone, bearish zone and target ladder prevents long intraday sessions from bogging down chart rendering, while ten documented indicator buffers let MQL5 coders inspect signals and carried levels cleanly via CopyBuffer.
The main trade-offs stem from broker-dependent tick volume and fixed internal constants. Signal parity with TradingView is not established, hard-coded fourteen-period ATR and close-position ratios reduce tuning flexibility without editing code, and unfiltered counter-trend absorption arrows can fire early against sustained directional runs unless paired with broader structure context.
Source, Licence and Distribution
- Rights
- Open source
- MT5 port by
- Eko Martha Kusumah (AlgoToolbox)
- Original author
- Thomas-Sterling
- Original work
- Smart Money Absorption Radar [Thomas]
- Licence
- MPL-2.0
- Version tested
- 1.00
- Tool type
- Indicator
Attribution. Smart Money Absorption Radar [Thomas] by , licensed under MPL-2.0. MT5 port by Eko Martha Kusumah: rewritten and tested in MQL5, published on AlgoToolbox. MT5 port source code on GitHub.
Frequently Asked Questions
Does the Absorption Radar MT5 port repaint signals or place live trades?
No, it neither repaints completed signals nor executes orders. Signal detection, zone drawing and dashboard cells update strictly on closed bars, so historical arrows stay fixed unless chart history reloads, and Entry, SL and TP lines remain visual reference levels only.
Why do Buy Pressure and Sell Pressure say NOT DETECTED when Last Event shows an absorption signal?
Those dashboard rows report two different time horizons by design. Buy Pressure, Sell Pressure and Volume describe only the most recently closed candle, whereas Last Event remembers the most recent qualifying absorption signal across later calm bars until a newer setup replaces it.
Why does Absorption Radar stop printing signals when switched to Real Volume on XAUUSD?
Most spot forex and metals CFD brokers broadcast zero or empty exchange volume while populating tick-update counts normally. When real volume reads zero, the twenty-bar volume average stays empty and the relative spike check never passes, so Tick Volume should remain selected on CFD symbols.
Can an Expert Advisor read the Entry, SL and TP buffers directly?
Yes, buffers five through nine expose Entry, SL, TP1, TP2 and TP3, while buffers one and two mark fresh buy and sell arrows on shift one. Because level buffers carry their values forward across later bars and hold zero before the first signal, your EA should trigger only when buffer one or two is non-zero.
Final Verdict: Who Should Use It
Absorption Radar suits discretionary MT5 chartists and MQL5 builders who want an open-source, closed-bar readout of volume-backed wick rejections, twenty-bar sweeps and ATR risk ladders without chart-object sprawl. Traders seeking automated trade management, broker-invariant exchange order flow or audited TradingView signal parity should look elsewhere or modify the MQL5 source directly.
Treat every plotted arrow and target ray as a local rejection hypothesis rather than a standalone trade instruction, especially when EMA Trend and Sweep filters remain off by default. An MT5 volume-and-wick absorption port with ATR reference levels, shown on XAUUSD H1/M30; Pine parity and profitability are unverified.
⚠️ Risk & Transparency Notice: All indicators, scripts, and backtest results on AlgoToolbox are for educational and testing purposes only. Trading Forex, CFDs, and cryptocurrencies carries significant financial risk. Past performance does not guarantee future results. This article may contain contextual affiliate links to tools or brokers we use. Read our full Risk Disclaimer.