Liquidity Hunter MT5 Port
Liquidity Hunter MT5 Port maps sweeps, structure and reference risk levels. BTCUSD captures show the interface, not profitability or verified Pine parity.
Liquidity Hunter MT5 Port brings liquidity sweeps, market structure and reference risk levels into one chart. We adapted the indicator for MetaTrader 5 with native plots, drawing objects and a top-left dashboard. It is a chart-analysis tool: its Entry, SL and TP labels do not place orders or calculate a position size.
This guide covers version 1.00, the source we inspected and the supplied BTCUSD H4 and M30 captures. The displayed target ladders match their selected 1R, 2R and 3R arithmetic. That is a limited visual/source check, not a profitability backtest or matched-data validation against the Pine original.
Test Bench
| Specification | Our configuration |
|---|---|
| Platform | MetaTrader 5 |
| Tool type | Indicator |
| Version tested | 1.00 |
| Symbol / timeframe | BTCUSD H4 / M30 |
| Data / tick mode | Supplied chart captures and static source/level checks; not a strategy backtest |
What Liquidity Hunter Is and Where It Comes From
We built the MT5 adaptation of Liquidity Hunter PRO SMC Edition [Thomas], the Pine v6 work by Thomas-Sterling. Our port organizes swing liquidity, break of structure, sweep-plus-MSS signals, the latest order block and fair value gap on each side, and an optional EMA trend condition.
It suits chart analysts who want those relationships visible without an execution engine. Signal arrows describe events, while the current Entry/SL/TP ladder records the last qualifying setup. A chart showing price beyond a target does not establish a filled trade, its entry timing or a realized return.
How It Generates Signals
Confirm swings, then look for a sweep
The source confirms a pivot only after Swing Length bars exist on its right as well as its left. At the default five, that is a five-bar confirmation delay. A bullish sweep requires a low below the stored swing low and a close back above it; a bearish sweep uses the inverse condition around a swing high. Its processing loop is intended to commit these events on completed bars.
A liquidity line can start at the older pivot’s chart position after that pivot is confirmed. Its historical anchor does not mean the level was known on the pivot bar itself. Keep that distinction when reading historical examples, because a completed chart can show information that was recognized later. The calculation has confirmation timing, not advance knowledge of future price.
Wait for the structure and candle conditions
A sweep arms the corresponding waiting state and stores its extreme as the proposed stop reference. A close beyond the stored opposite structure level must agree with candle direction and reach the selected ATR body threshold. The default body threshold is 0.15 times ATR(14). The wait expires when its age exceeds ten bars; an opposite sweep can replace the pending direction.
Order blocks and fair value gaps are additional displays, not mandatory conditions inside the supplied BUY/SELL expressions. Turning a zone display off is therefore different from changing the signal filter. Likewise, EMA 50 and 200 can remain visible while Enable EMA Trend Filter is false, as in the Inputs capture. Only enabling that separate filter makes the EMA trend condition part of signal eligibility.
Draw a reference ladder, not a managed trade
For a qualifying BUY, the source takes the signal close as Entry and the stored sweep low as SL; targets sit above Entry at the selected risk multiples. SELL uses the stored sweep high and subtracts the multiples instead. This measures price distance, not account risk. The supplied source has no broker-order execution calls and does not know whether a reader actually entered.
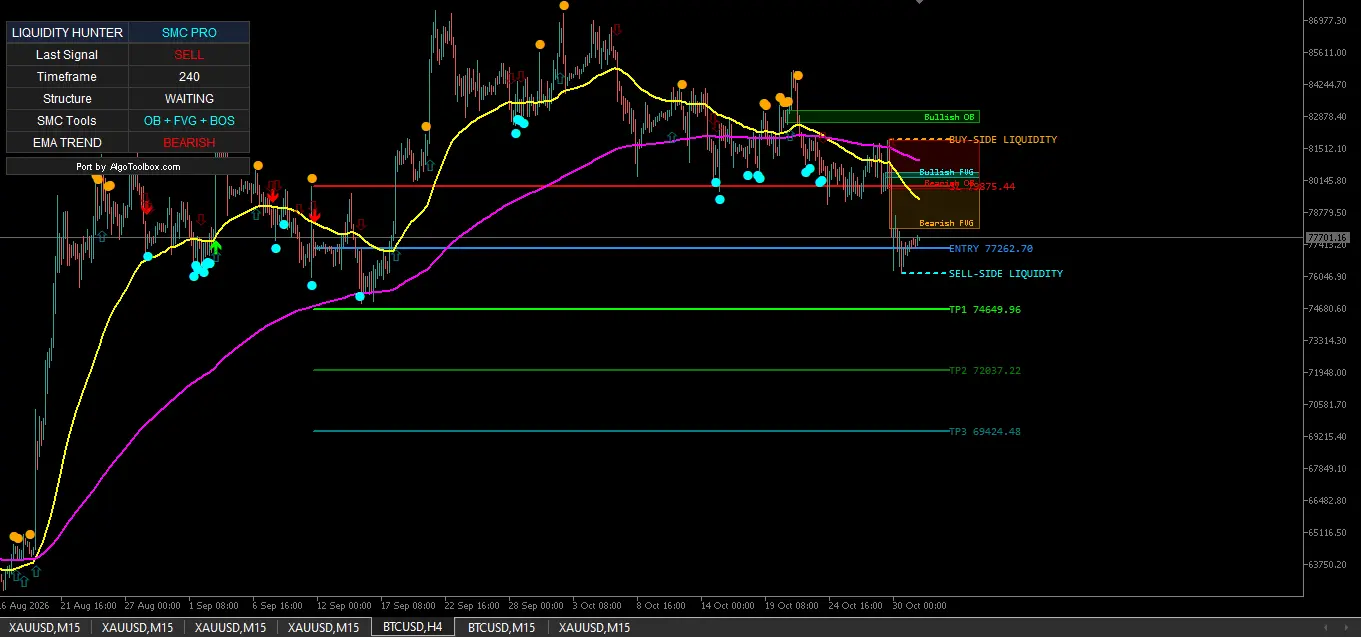
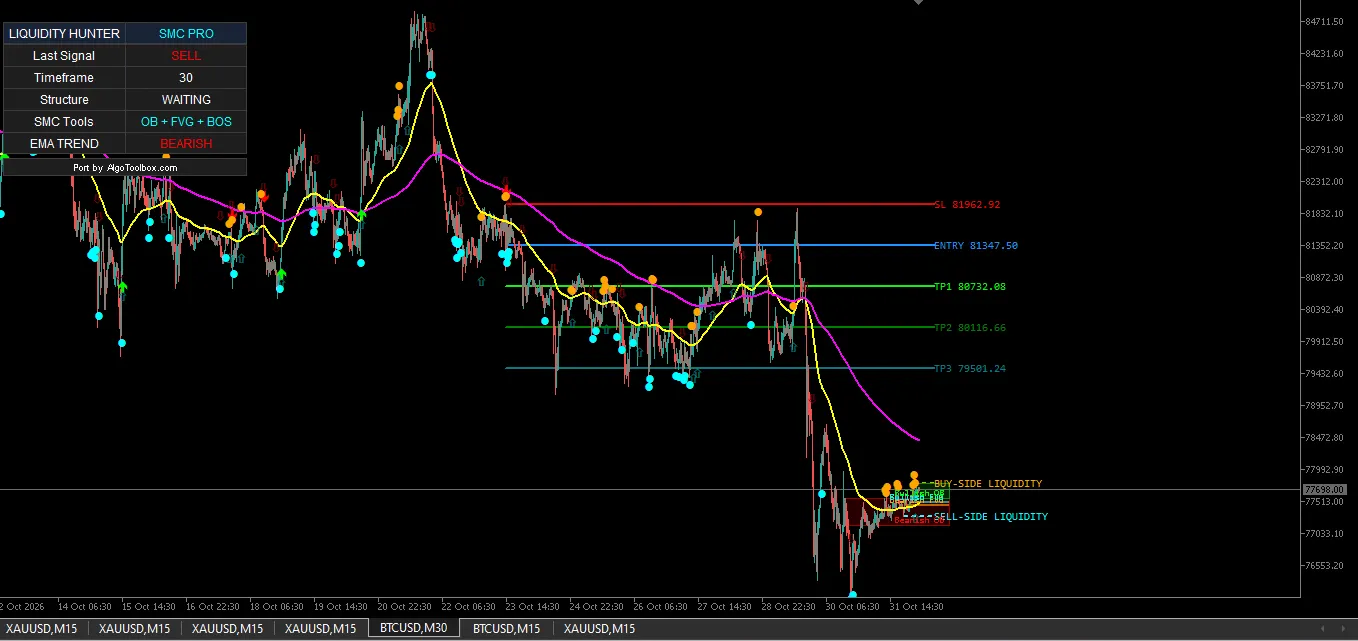
The latest signal’s levels persist until another qualifying signal replaces them. Last Signal can consequently remain SELL while Structure reads WAITING, because those cells describe different states. The SMC Tools row lists available components rather than confirming that all filters agree. Neither the panel nor a target line is a substitute for checking when the setup formed and whether it remains relevant to your analysis.
What Changed in Our MT5 Port
Pine drawing primitives became MT5 arrow buffers, trend lines, rectangles, text labels and dashboard objects. The source declares thirteen buffers: eight plotted series and five internal level workspaces. The dashboard moves to the top-left, and MT5’s arrow presentation does not reproduce Pine’s text-bearing shapes exactly; appearance should not be mistaken for a matched-platform parity result.
The port commits structure and signal state on closed bars but previews the EMA lines on the forming bar. Its dashboard trend and structure readings use the last processed closed-bar state, so a moving EMA line can differ temporarily from the panel. The native MT5 source repository records the implementation and known differences; this page remains the project guide rather than redirecting the explanation to a code mirror.
There are calculation differences to respect. The pivot loop uses strict comparisons, and the BOS expression compares the previous close with the currently stored structure level, which can differ from Pine when a pivot updates that level. EMA/ATR initialization is not established as bit-identical. The minimum-distance condition also uses _Point; MQL5 distinguishes a quote point from a trade tick size in its symbol properties.
Inputs and Defaults
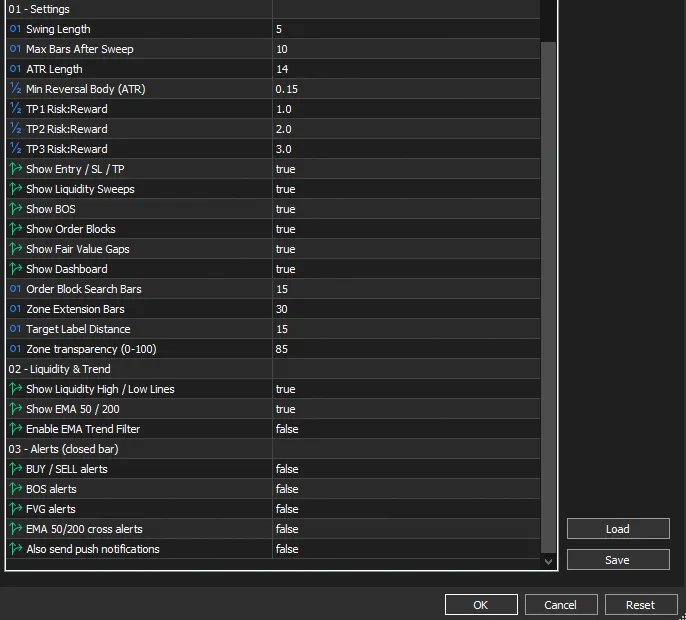
The table summarizes the working controls rather than reproducing all source metadata fields. Defaults below come from the supplied source; the recorded Inputs capture agrees on the main logic settings but shows Zone transparency at 85 rather than the source default 80. This is a recorded visual difference, not evidence of a signal improvement.
| Input group | Source default | What it controls | Captured context |
|---|---|---|---|
| Swing Length | 5 | Bars on either side for pivot confirmation | 5; confirmation is delayed, not known at the pivot |
| Max Bars After Sweep | 10 | Age allowed for the waiting structure setup | 10; expires after the allowed age |
| ATR / minimum body | 14 / 0.15 ATR | Directional candle-body qualification | 14 / 0.15, not a whole-wick requirement |
| TP1 / TP2 / TP3 | 1R / 2R / 3R | Price-distance target ladder | 1.0 / 2.0 / 3.0 |
| Entry levels, sweeps, BOS, OB, FVG, dashboard | All shown | Visual layers; OB/FVG visibility is not signal confluence | All true in the capture |
| OB search / extension / label / transparency | 15 / 30 / 15 bars; 80 | Opposite-candle search, drawing placement and zone fill | 15 / 30 / 15; 85 in the capture |
| Liquidity lines / EMA display / trend filter | true / true / false | Separates visual trend context from signal filtering | Same; EMAs shown, trend filter off |
| Signal, BOS, FVG, EMA and push alerts | All false | Opt-in notification groups | All false; delivery was not demonstrated |
Start by understanding Swing Length, the waiting window and the candle-body threshold, not by searching for the most attractive historical arrows. Larger swing lengths require more right-side confirmation, and a shorter wait changes how long a sweep remains eligible. The code rejects several invalid lower bounds, but its checks do not mirror every Pine input limit; extreme values deserve caution rather than a parity assumption.
How We Checked This Snapshot
The evidence here is deliberately limited: supplied source, public repository/release inspection and two chart captures, not a trade-performance report. The uploaded and repository MQL5 texts agree after line-ending normalization, as does the source in the checked release. We did not run MetaEditor or a matched-feed TradingView/MT5 replay for this snapshot, and a version label alone is not proof of exact binary/source correspondence.
| Check | Symbol / timeframe | Recorded finding | Evidence and limit |
|---|---|---|---|
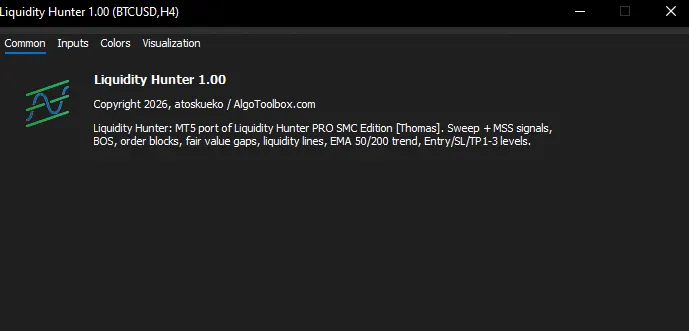
| Version and source comparison | MT5 port 1.00 | Uploaded, repository and release source text match after line-ending normalization | Source inspection; About capture in Figure 4. Compilation not independently checked |
| Displayed SELL ladder arithmetic | BTCUSD / H4 | Entry 77,262.70; SL 79,875.44; 1R distance 2,612.74; targets 74,649.96 / 72,037.22 / 69,424.48 | Figure 1; displayed values calculate to 1R/2R/3R. No fills, target-hit sequence or returns established |
| Displayed SELL ladder arithmetic | BTCUSD / M30 | Entry 81,347.50; SL 81,962.92; 1R distance 615.42; targets 80,732.08 / 80,116.66 / 79,501.24 | Figure 3; same arithmetic check, not an independent strategy backtest |
| Configuration comparison | Supplied Inputs | Main captured logic settings match the source; transparency 85 differs from default 80 | Figure 2 and input declarations. Reload behavior, alert delivery and Pine parity were not tested |
The H4 and M30 examples demonstrate reference-level arithmetic and visible interface elements, not how often signals occur or what a trader could have earned. Other symbol tabs in a terminal window do not establish that the indicator was tested on those symbols. We have not converted the pictures into a win rate, a target-hit record or an account drawdown figure, because the supporting execution evidence does not exist here.
Limitations and When to Turn It Off
Do not call this a universally non-repainting or tick-identical Pine conversion from the captures alone. The closed-bar signal path is visible in the source, but forming-bar EMA previews change normally, recent drawings are replaced, and a history reload can recompute state. Pivot ties, structure-level updates, initialization and symbol quoting differences can affect alignment. No matched-data parity or comprehensive reload test was supplied.
Use one instance per chart: the current object names share the LHP_ prefix, and removal deletes objects with that prefix. The latest-only object approach also means old zones are not a complete historical archive. If multiple instances collide, a dashboard obscures price, or the drawing layout becomes hard to read, remove the extra instance or reduce visual layers rather than interpreting clutter as added confirmation.
The source maps Entry/SL/TP values to internal calculation buffers, but external EA consumption was not validated here. Do not treat a documented index as a tested automated-trading interface, and do not let sample integration code replace your own checks. Similarly, alert switches being present does not prove desktop or phone delivery; those controls were off in the capture, and historical signal arrows are not evidence of historical notifications.
How It Compares
Our FVG Sniper MT5 Port is a narrower alternative when imbalance drawings are the main requirement. Reaction Level Matrix MT5 Port takes a different level-based approach, so similar-looking areas should not be treated as identical signal rules. Compare what each tool actually calculates and exposes, rather than ranking chart examples as if they were matching trading-system results.
Liquidity Hunter’s distinction is the sweep-to-structure sequence with a reference risk ladder, while OB/FVG layers provide optional context. Whether that combination helps your process is a workflow question, not a measured profitability advantage in this post. The Our Builds catalog separates these adaptations from third-party test reports; an original author’s work and our implementation should not be confused.
Installation
Use the checked version 1.00 release files: LiquidityHunter.ex5 for the compiled indicator and LiquidityHunter.mq5 for source inspection or local compilation. Put the indicator in your terminal’s MQL5/Indicators/ directory, refresh Navigator and attach one instance to a chart with sufficient history. The repository describes the remaining validation limits.
If compiling locally, open the source in MetaEditor, press F7 and inspect the actual errors and warnings before attaching the result. Start with the recorded settings, separate display controls from the trend filter, and enable an alert group only when wanted; push also needs your terminal’s own notification configuration.
The Algo Trading switch is not needed for this indicator’s analysis, and the supplied source does not place, modify or close broker orders. Apply ordinary caution before relying on any signal elsewhere in your workflow, particularly if another program is intended to consume its outputs. The MT5 indicator collection includes other chart tools, not a promise that any one is a complete execution strategy.
Advantages and Disadvantages
Useful characteristics
- Sweep, structure, zone and trend context can be viewed together without placing broker orders.
- The reference ladder makes the selected 1R/2R/3R price arithmetic explicit.
- EMA display and signal filtering are separate, inspectable controls.
- Source and porting notes make implementation differences visible instead of claiming unexplained parity.
Limits to accept
- Pivot confirmation is delayed, while some drawings begin at an older chart position.
- Only the latest zones and signal levels remain as objects; historical arrows are not matched active plans.
- Initialization, pivot ties and structure comparisons can differ from Pine.
- Exact-source compilation, alert delivery, external buffer use and matched-feed parity were not validated here.
- No trading return, fill sequence or risk-adjusted performance follows from these chart examples.
Source, Licence and Distribution
- Rights
- Open source
- MT5 port by
- Eko Martha Kusumah (AlgoToolbox)
- Original author
- Thomas-Sterling
- Original work
- Liquidity Hunter PRO SMC Edition [Thomas]
- Licence
- MPL-2.0
- Version tested
- 1.00
- Tool type
- Indicator
Open the original script MT5 port source (GitHub)
Attribution. Liquidity Hunter PRO SMC Edition [Thomas] by , licensed under MPL-2.0. MT5 port by Eko Martha Kusumah: rewritten and tested in MQL5, published on AlgoToolbox. MT5 port source code on GitHub.
Frequently Asked Questions
Does Liquidity Hunter MT5 Port repaint?
The source commits structure and signal state on completed bars, but that is not a blanket replay/reload assurance. EMA values still preview the forming bar, confirmed pivots appear with a delay, and the latest drawing objects are replaced as state changes. The supplied captures do not establish identical historical and live behavior on every feed or after history changes.
Are Entry, SL and the targets actual orders?
They are reference prices calculated from the last qualifying setup, not broker instructions. The source has no trading execution calls and does not calculate lots, track actual fills or manage an account. A target drawn below a SELL entry can be correct arithmetic without establishing that a trader entered, avoided the stop or realized that target’s return.
Why can the dashboard say SELL and WAITING together?
Last Signal stores the most recent qualifying direction until another signal replaces it, whereas Structure describes the last processed closed bar’s BOS state. WAITING does not erase that previous signal or create a new trade instruction. EMA TREND is another contextual reading; with the trend filter disabled, showing the EMA lines does not make their direction a mandatory signal condition.
Has the port been shown to match Pine exactly?
No matched-feed parity test was provided. We inspected the code and checked the displayed target arithmetic in two BTCUSD captures, which is a narrower task. Pivot ties, series-level crossover handling, initialization and minimum-distance checks may differ. The screenshots and a version label are not proof of tick-for-tick equivalence, and the repository’s validation warning should remain part of any evaluation.
Final Verdict: Who Should Use It
Liquidity Hunter MT5 Port is for manual chart study by users who understand delayed swing confirmation, optional visual context and the distinction between a signal plan and an executed position. It is not a shortcut to an account-performance claim or a validated drop-in EA dependency. Keep the source’s documented differences and the limited evidence attached to the chart examples rather than reading hindsight into them.
Start with one chart instance and a clear reason for each visible layer, then decide whether the sweep/structure sequence adds useful context to your own analysis. Treat reload, alert and integration behavior as unverified where no actual check is recorded. An MT5 liquidity-and-structure port with reference risk levels, shown on BTCUSD H4/M30; parity and profitability are not established.
⚠️ Risk & Transparency Notice: All indicators, scripts, and backtest results on AlgoToolbox are for educational and testing purposes only. Trading Forex, CFDs, and cryptocurrencies carries significant financial risk. Past performance does not guarantee future results. This article may contain contextual affiliate links to tools or brokers we use. Read our full Risk Disclaimer.