StatBoard MT5 Trade History Dashboard
Review closed MT5 trades on-chart with StatBoard: period, symbol and EA filters, costs, and a realized-results curve, with reporting limits explained.
StatBoard is a free MT5 indicator that turns closed-trade history into an on-chart dashboard. Choose a period, see what’s left after costs, and break the result down by symbol, opening hour, or a configured list of EA magic numbers. It reports account activity without placing trades or producing signals.
I run more than one EA on the same account. At the end of most days, I want to know what today actually made, with costs included, and which EA contributed. We built StatBoard to make that question quicker to answer. I’ve used it daily since; this page explains how to read it.
On this page15 sections
- Test Bench
- The account questions StatBoard answers
- Read one session: select, filter, compare
- Seven periods and five views
- Understand the Summary figures
- The Costs button is the first setting to check
- How to read the closed-trade curve
- What the numbers leave out
- Installation and a sensible first check
- Our take: useful for the next account question
- Inputs and display settings
- Troubleshooting missing or unexpected results
- Source, Licence and Distribution
- Frequently asked questions
- Changelog and availability
Test Bench
| Specification | Our configuration |
|---|---|
| Platform | MetaTrader 5 |
| Tool type | Indicator |
| Version tested | 1.00 (static source review only) |
| Symbol / timeframe | XAUUSDc visible in screenshots; static documentation review only M5 visible in screenshots; reporting is not a timeframe-specific strategy test |
| Test period | Uploaded version 1.00 source and screenshots reviewed; no terminal test performed |
| Data / tick mode | Static source and screenshot inspection; no Strategy Tester tick mode |
| Account & spread | Not independently verified; amounts follow the account deposit currency |
The account questions StatBoard answers
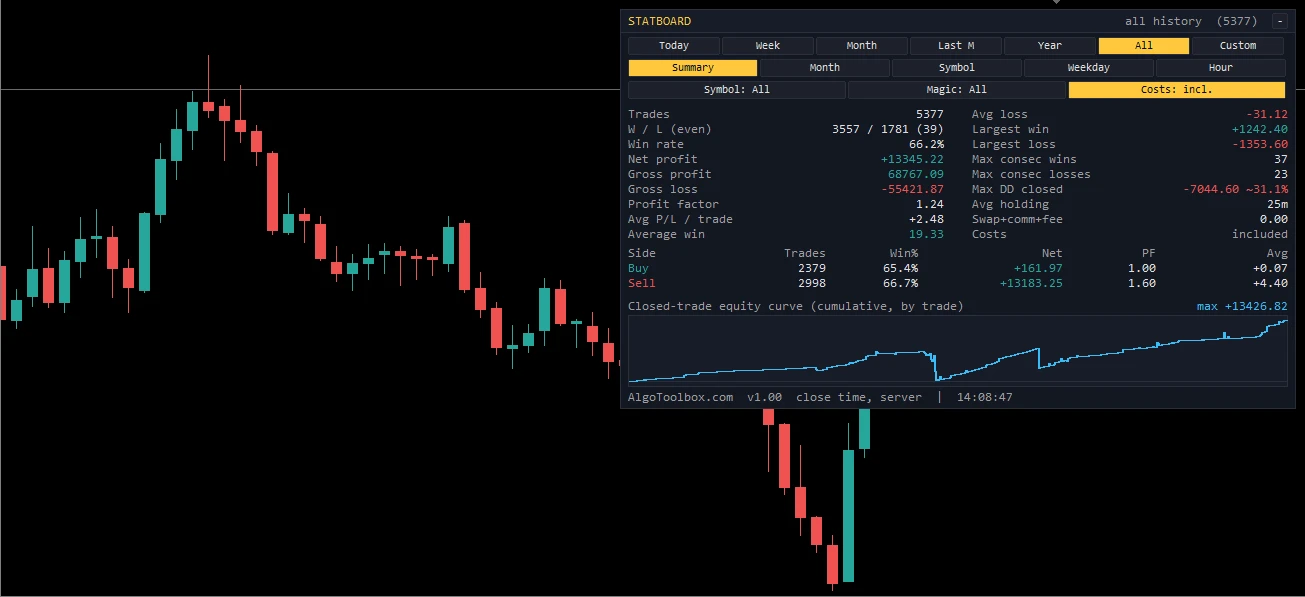
The history is already in the terminal. Turning it into a useful comparison takes some filtering or exporting. StatBoard keeps the common questions on the chart: seven period buttons across the top, five views underneath, and the active filters in the next row.
- What did today make? Select Today and Summary, enable costs, and read the Net profit row. The period follows server time, so its day boundary may differ from your local midnight.
- Is this month better than last? Switch between Month and Last M with the same filters. Month is month-to-date; Last M covers the previous calendar month. Compare trade counts alongside the result.
- Which symbol is losing money? Leave the symbol filter on All and select the Symbol view. Each symbol has its own trade count, win rate, net result, profit factor, and average. A negative row gives you somewhere to start looking; it isn’t a reason to change the EA on the spot.
- Which EA contributed? Enter its magic number in the Magic list input, then activate the Magic filter. Several comma-separated numbers form one combined selection. To inspect one EA, use its number alone; the panel does not create a separate tab for every EA.
- What happens at different hours? Select Hour to group the selected closed trades by their opening hour. Weekday uses opening day; the Month view groups by closing month.
The Buy and Sell table below Summary helps when the overall result hides a gap between the two directions. One side can do most of the earning while the other contributes little or loses money. Check the sample size before treating that difference as a persistent pattern.
Read one session: select, filter, compare
Start with a specific question, such as which EA contributed to today’s closed result. Keep the Summary view visible while you narrow the selection:
- Select Today. This selects records by closing time within the current server day, including positions opened earlier that closed today.
- Enable costs. Check that the button reads Costs: incl. before interpreting the net result.
- Begin with Symbol: All and Magic: All. This gives you the broad account result before narrowing it.
- Switch the symbol filter to the chart symbol if you want that instrument alone. It is an All/chart-symbol toggle, rather than a dropdown of every symbol in the account.
- Activate your configured Magic list. For a single-EA check, configure just that EA’s number in the indicator inputs. Read the new trade count as well as net profit.
- Compare Buy and Sell. Check whether both directions contributed, then return to All filters before asking an account-wide question.
For example, suppose the unfiltered result is 120 account-currency units and an EA-filtered selection shows 90. The other selected records contribute 30 only if both figures use the same period, symbol selection, and cost mode. Confirm the attribution of known closing deals before calling the 90 that EA’s result.
Seven periods and five views
Period buttons select the records; view buttons decide how to present them. Keep those two jobs separate when comparing results.
| Period | Selection |
|---|---|
| Today | Closings from the current server day. |
| Week | Closings from Monday at 00:00, using the server clock. |
| Month | Closings from the start of the current calendar month. |
| Last M | Closings within the previous calendar month. |
| Year | Closings from the start of the current calendar year. |
| All | All qualifying available closed-trade records. |
| Custom | Closings between the two dates and times configured in inputs. |
Summary shows the selected totals and Buy/Sell split. Month groups by closing month, newest first. Symbol groups by the exact symbol name. Weekday and Hour group those selected records by opening time. Consequently, Today’s Hour view can include an opening hour from an earlier day when a position was held overnight.
Tables use the configured rows-per-page limit. Use their page controls when the selection produces more rows than fit on one page. Symbol rows are not explicitly alphabetically sorted by the source; read the labels rather than relying on a fixed order.
Understand the Summary figures
Trades counts the qualifying closing records. W / L (even) separates positive, negative, and zero results under the current cost mode. Win rate divides wins by the full count, including even records. For example, six wins, three losses, and one even result give a 60% win rate.
Gross profit sums positive selected results; Gross loss sums negative ones. With costs included, those results already contain the recorded charges. These labels therefore do not necessarily mean pre-cost figures. Profit factor divides the positive sum by the absolute negative sum: 300 gained against 200 lost gives 1.50.
Avg P/L / trade divides net result by all selected records. Average win and Avg loss use only their respective positive and negative records. Largest win and loss show individual extremes; they do not describe open-position exposure. Max consecutive wins and losses follow the closing sequence. Even records do not reset those runs in version 1.00.
Avg holding measures time from the reconstructed position opening to each closing record. Partial closes contribute separate holding times. Swap+comm+fee shows the recorded charge total; Costs states whether that total is included in results. The Buy/Sell rows apply the same accounting to each direction.
The Costs button is the first setting to check
The filter-row button reads Costs: incl. or Costs: excl. It controls whether recorded swap, commission, and fee amounts enter each trade’s result. The Summary view also states whether costs are included.
Keep the period, symbol, and Magic filters unchanged when comparing the two modes. Change those too, and you’re comparing different trades as well as different accounting. On a scalping account, a small average result per trade can leave little room for these charges.
The switch can change more than net profit. The panel uses the selected result to classify wins and losses, so a small winner before charges can become a loser after them. Win rate, profit factor, average win and loss, and consecutive runs can change too. Spread remains embedded in the execution prices; the button does not remove it.
Partial closes need a closer look: version 1.00 attaches a position’s accumulated entry commission and fees to its first recorded closing portion. Later partial closes receive their own closing charges. A period containing that first partial close can therefore carry entry costs for more volume than it closed. For a broader look at trading friction, see why an MT5 backtest can fail live.
How to read the closed-trade curve
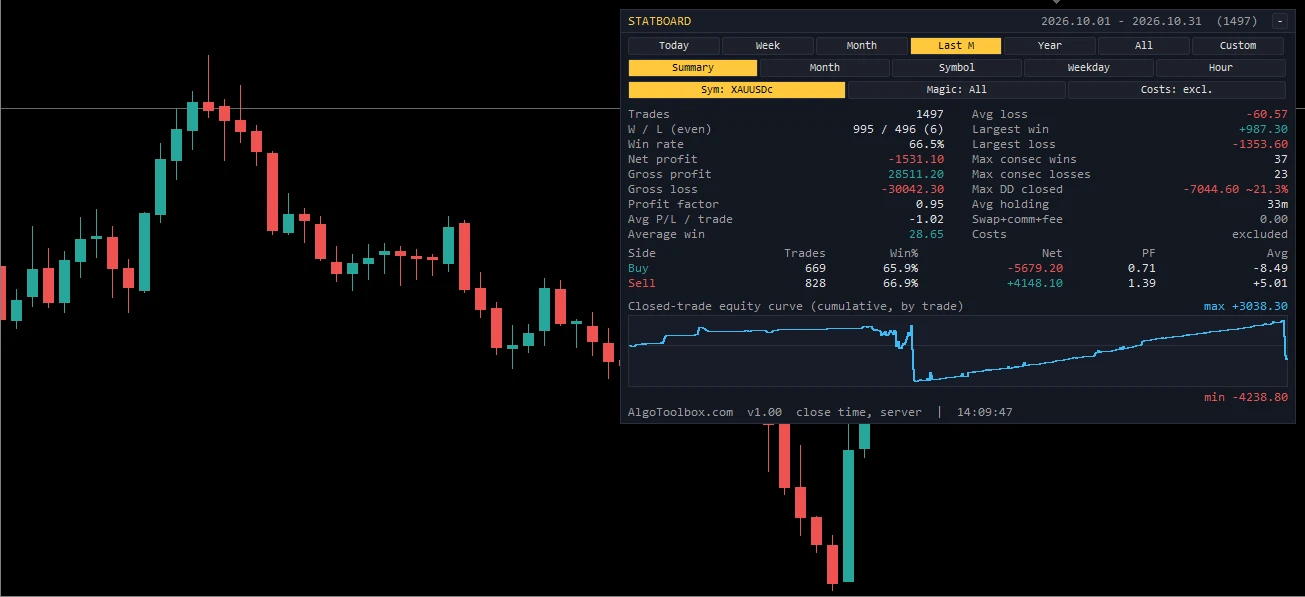
The line adds your selected closed-trade results one by one, oldest to newest. It starts from zero and follows the active period, symbol, Magic, and cost settings. It shows cumulative realized trading results, without adding the account’s starting deposit or the floating profit on open positions.
Max labels the highest cumulative result. Min appears when the line falls below its zero starting point. No Min label doesn’t mean there was no drawdown: a line that rises from zero to 1,000 and then falls to 600 has lost 400 from its peak while remaining positive.
The curve rescales when you change filters. Today and All can fill roughly the same panel height while representing very different amounts. Check the labels and Summary values before judging the shape.
Max DD closed measures the largest peak-to-trough drop in this selected closed-trade sequence. Treat its percentage as approximate: the code uses current account balance minus the selected net result, plus the cumulative peak at that drawdown. Deposits, withdrawals, or symbol and Magic filters can make that base differ from a reconstructed historical account balance. It also misses losses that occurred while positions remained open. Our drawdown reference explains why balance and equity measures answer different questions.
What the numbers leave out
Open positions are outside these statistics. A positive closed-trade curve can sit alongside a large floating loss elsewhere on the account. Use the terminal’s open-position and equity information alongside this panel.
A partial close creates its own closed-trade record. Closing half a position and closing the rest later contributes two records, even if your statement presents them as one position. Compare netting reversals and close-by operations with your statement too: rebuilding results from deals doesn’t always give the same picture as a position-level report.
The loader requests trade history through MT5’s HistorySelect function. Results depend on the history available to the terminal and account; the panel can’t recover broker records that aren’t available. It processes buy and sell deals, rather than treating deposits, withdrawals, or separate balance adjustments as trading profit.
Magic attribution uses the recorded closing deal’s magic number. If another EA or a manual action closes a position, check how the broker records that exit before assuming the filter identifies the EA that opened it. If EAs share a magic number, the filter can’t separate them cleanly either.
Amounts follow the account’s deposit currency. A number shown in USC isn’t the same amount in USD. The screenshots are examples of the interface, not a currency conversion or an independently reconciled statement.
Installation and a sensible first check
- Install through the Market. Open the StatBoard Trade History Analyzer listing and follow its MetaTrader 5 installation flow. Use the intended terminal if you have several installations. This route installs the Market product; no manual source compilation is required.
- Locate the installed indicator. Find StatBoard among the installed Market indicators in MT5’s Navigator and attach it to a chart. It can sit alongside an EA without occupying the EA slot. Use one StatBoard instance per chart: its panel objects share a common naming prefix.
- Set the initial inputs. Leave costs enabled and begin with the default refresh interval. Choose the panel theme and font size. Leave the Magic list empty for the first account-wide comparison; configure individual numbers afterward.
- Check the chart symbol. Choose the instrument you want the chart-symbol filter to select. Broker suffixes matter: XAUUSD and XAUUSDc are different symbol strings.
- Check All before narrowing. Use All, Summary, Symbol: All, Magic: All, and costs included. Compare against the statement for matching available history. For a restricted statement period, configure Custom dates rather than comparing unlike ranges.
- Inspect a few known records. Include a normal full close and, if applicable, a partial close. Check the recorded currency, costs, and closing-deal magic number before relying on the breakdown.
- Save the setup you need. Enter your EA’s magic number or combined list, then activate the on-chart filter. Configure both Custom endpoints before using that period; the source defaults are fixed dates, not a rolling range.
The panel widens to fit its text, so longer numbers or labels can take more chart space. The minus button collapses it to one line. Choose a light or dark panel theme and adjust the font size and placement to suit the chart.
Our take: useful for the next account question
The useful part is moving from an account total to a narrower question without exporting another report. Period buttons, cost accounting, and the directional split make that comparison accessible on the chart. The included light theme also makes the panel usable without changing a white chart to suit it.
The trade-off is scope. This is a closed-deal dashboard, with limited reconstruction of position history and no floating-equity monitoring. It is a good fit for a quick review followed by inspection of the underlying deals. Keep the statement for reconciliation and the terminal’s equity information for current exposure. A favorable hourly row alone is insufficient evidence to change trading hours.
Inputs and display settings
These are the version 1.00 source defaults. The on-chart controls change the current period, view, symbol selection, Magic-filter state, and cost mode. Custom dates and the configured Magic list come from indicator inputs.
| Input | Default | What it controls |
|---|---|---|
| InpMagics | Empty | Comma-separated magic numbers. An empty list leaves all magic numbers eligible. |
| InpCustomFrom | 2026.01.01 00:00 | Custom period start in server time. |
| InpCustomTo | 2026.12.31 23:59 | Custom period end in server time. Set this deliberately for your required range. |
| InpStartCosts | true | Starts with recorded swap, commission, and fees included. |
| InpRefreshSec | 10 | Refresh interval in seconds. History rebuilding is gated by a change in deal count. |
| InpFontPt | 9 | Panel font size. |
| InpRightSide | true | Places the panel on the right side. |
| InpPanelX | 10 | Horizontal panel margin in pixels. |
| InpPanelY | 10 | Vertical panel margin in pixels. |
| InpPanelW | 440 | Minimum width in pixels; text can make the panel wider. |
| InpShowCurve | true | Shows the cumulative closed-trade curve. |
| InpCurveH | 70 | Curve height in pixels. |
| InpMaxRows | 12 | Table rows per page, up to the internal 28-row capacity. Zero uses that capacity rather than an unlimited single page. |
| InpTheme | THEME_DARK | Dark or light panel colors. |
The MQL5 HistorySelect documentation describes the history-selection mechanism. For partial closes, entry/exit types, and recorded magic numbers, the relevant reference is deal properties.
Troubleshooting missing or unexpected results
- Nothing appears in a selection: return to All, Symbol: All, and Magic: All. Then reapply one restriction at a time. Check Custom dates and the availability of closing records.
- An EA seems absent: inspect a known closing deal’s magic number. Check for shared numbers, manual exits, another EA closing the position, and the exact chart-symbol suffix.
- Today differs from your local day: compare server timestamps. The period boundary follows the server, while Hour and Weekday use opening time within the selected closing records.
- A statement total differs: align date range and cost mode, then inspect partial closes, entry-cost allocation, currency, and balance adjustments. Use the MT5 report-reading guide for the distinction between deals, positions, and reported statistics; its tester examples do not turn this dashboard into a backtest.
- The panel covers the chart: collapse it or adjust its side, margins, minimum width, font size, or curve height. A zero row cap can make tables tall.
Refresh uses a timer with a two-second minimum, but history rebuilding depends on a changed deal count. Reducing the interval does not make it continuously reconcile edits to existing history. These are checks suggested by the source’s behavior, rather than diagnoses of your terminal.
Source, Licence and Distribution
- Rights
- Freeware
- Developer
- Eko Martha Kusumah (AlgoToolbox)
- Licence
- Freeware (see Market terms)
- Version tested
- 1.00 (static source review only)
- Tool type
- Indicator
Frequently asked questions
Does StatBoard place trades or provide entry signals?
No. It is a chart-window indicator for reporting closed-trade history, with no plotted indicator buffers or trading signals. It does not manage positions or choose entries. Changing the chart timeframe won’t turn these statistics into a timeframe-specific strategy test; the controls choose which history gets summarized.
Can it show the results of one EA on a shared account?
Use that EA’s magic number alone in the Magic list, then activate the filter. Multiple numbers combine their records into one selection. Attribution follows closing-deal magic numbers, so shared numbers, manual exits, or another EA closing positions can complicate the interpretation. Check a few known trades before relying on the split.
Why might the trade count differ from my statement?
The panel creates a record for each qualifying closing deal, so partial closes can increase the count relative to a position-based statement. Netting reversals and close-by handling can also differ. Compare the same period and cost mode first, then inspect the underlying deals before treating a difference as a missing trade.
Does the closed-trade drawdown include floating losses?
No. It measures declines between cumulative realized results in the current selection. It cannot show an intratrade equity low or the floating loss of an open basket. Keep the account’s live equity and open positions visible when assessing exposure; a smooth realized-results curve doesn’t tell the whole story.
Changelog and availability
Version 1.00 provides seven periods, five reporting views, symbol and Magic-list filters, selectable cost accounting, a cumulative closed-trade curve, and light and dark themes. The Market release is free, with every feature included. We built it because the same account question kept coming up: what did the day actually make, and where did it come from?
There are no additional roadmap features to announce here. Start by comparing one period with your statement, then use the breakdowns that help you make sense of your own account.
Risk & Transparency Notice: All indicators, Expert Advisors, and Strategy Tester runs on AlgoToolbox are for educational and evaluation purposes only. Trading Forex and CFDs carries substantial financial risk, and backtest results do not guarantee live performance. Read our full Risk Disclaimer.