MT5 Backtest Overfitting: Seven Red Flags in EA Sales Reports
Smooth equity curves rarely mean an edge. Check these seven MT5 backtest overfitting and data red flags before trusting any commercial EA screenshot.
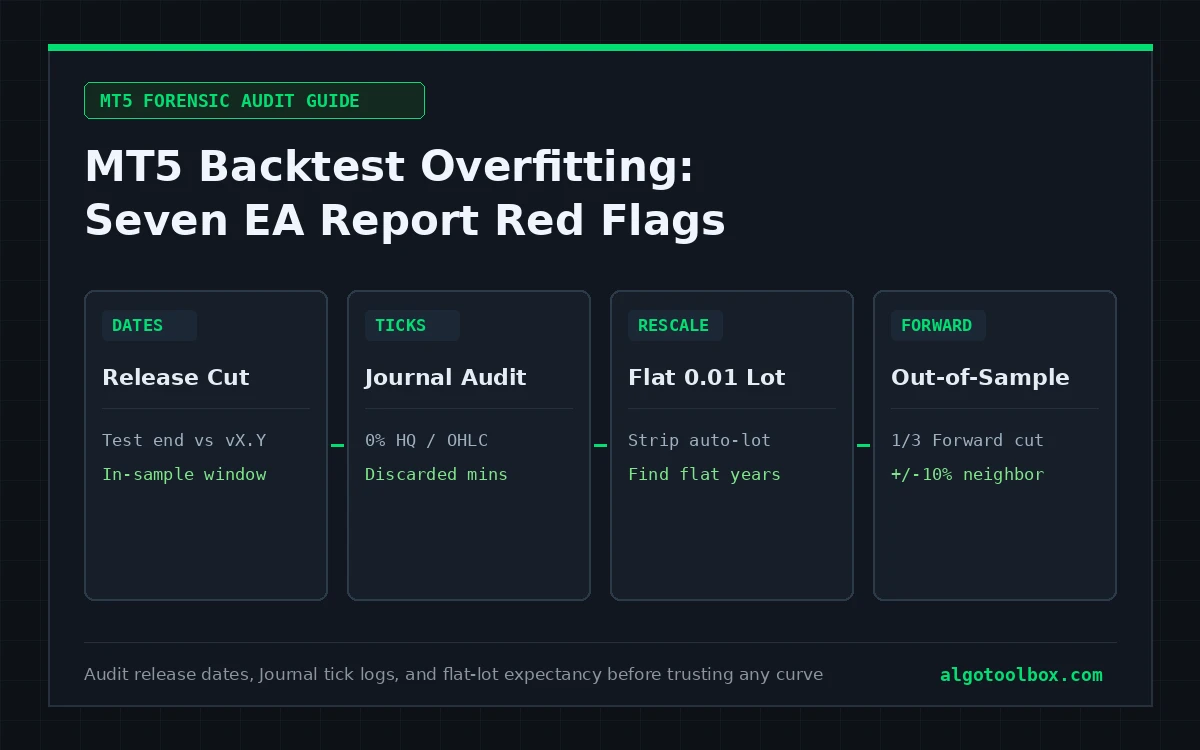
Most losing commercial Expert Advisors do not blow up because of a coding bug or a hidden grid. They fail because of MT5 backtest overfitting: tuning entry periods, stop distances, hour filters, and modeling settings until the Strategy Tester memorizes past gold or forex noise instead of capturing a repeatable market behavior. On a marketplace screenshot, a curve-fitted robot with hard stop-losses and fixed fractional sizing looks cleaner than a genuine strategy ever will.
You do not need the developer’s .mq5 source code to catch most of these illusions. By cross-checking the product’s version changelog, the Strategy Tester Journal, a flat 0.01-lot deal export, and MetaTrader 5’s built-in Forward split, you can separate durable logic from hindsight engineering before risking demo time or licence fees.
On this page7 sections
- What Overfitting Actually Looks Like in MetaTrader 5
- Red Flags 1–2: In-Sample Release Dates and Historical Hour Blackouts
- Red Flags 3–4: M1 OHLC Recipes and Discarded Real-Tick Headers
- Red Flags 5–6: Compounding Scale Masks and Unverifiable Cloud Filters
- Red Flag 7: Parameter Cliffs and Built-In MT5 Forward Validation
- Where to Go Next
- FAQ
What Overfitting Actually Looks Like in MetaTrader 5
A backtest can mislead you in three distinct ways. It can ignore live execution friction such as spread widening and stop slippage (which we stress-test in Why a Good MT5 Backtest Dies Live). It can hide unclosed floating losses inside basket averaging (covered in How to Spot Hidden Grid and Martingale Logic in an MT5 Backtest). Or it can pass both checks — single position, broker-side stop-loss, realistic commission — and still fail immediately because every parameter was fitted to the exact historical window shown on the sales page.
MetaTrader 5 makes accidental or deliberate curve-fitting fast. Using the genetic optimizer in Strategy Optimization, an author can evaluate tens of thousands of combinations across indicator periods, ATR multipliers, break-even triggers, and session toggles in an afternoon. Add eight or ten free inputs to any mediocre breakout rule on six years of XAUUSD history, and the top optimization pass will almost always show a Profit Factor above 2.0 and a smooth upward curve — purely by side-stepping the worst historical weeks.
| Red flag | Where it hides | Where to verify in MT5 | What happens live |
|---|---|---|---|
| 1. 100% pre-release window | Six-year backtest ending the week a new version launched | Compare report end date to MQL5 Market What's New dates |
Curve stalls or reverses the week after optimization ends |
| 2. Surgical hour/date blackouts | TimeFilter profiles or hard-coded shock-date skips |
Inputs tab session toggles & per-hour trade distribution |
Future volatility arrives in “allowed” hours instead |
3. Seller-mandated 1 minute OHLC |
Listing instructions telling buyers not to use real ticks | Re-run the same window on Every tick based on real ticks |
Intrabar whipsaws hit stops before synthetic trailing locks win |
| 4. Discarded real-tick headers | HTML report header claiming 100% real ticks or 0% HQ |
Search Strategy Tester Journal for real ticks discarded |
Scalper tested on smooth 4-tick bars bleeds on jumpier live quotes |
| 5. Auto-lot compounding mask | Exponential dollar growth from Risk % or balance multipliers |
Re-run or rescale all deals at a flat 0.01 fixed lot |
Early drawdowns and 9–14 month flat regimes reappear at full scale |
| 6. Unverifiable cloud / signal hooks | Server-side “AI” or news filters via WebRequest; deposit-padded signals |
Tester Journal filter logs & MQL5 Signal deposit/withdrawal lines |
Paid external filter was never tested in the demo curve you ran |
| 7. Sharp parameter cliffs | Locked presets with oddly specific values (SL = 317, RSI = 13) |
Forward mode (1/3) + ±10% input perturbation |
Minor volatility regime shift pushes inputs off their narrow peak |
Red Flags 1–2: In-Sample Release Dates and Historical Hour Blackouts
Red Flag 1: Every Trade in the Report Predates the Version You Are Buying
The fastest overfitting check takes thirty seconds and does not even open MetaTrader 5. Look at the publication date — and the most recent parameter-changing update under What’s New — on the vendor’s listing, then compare that date to the Strategy Tester report period.
Any price history that already existed on the day the developer tuned or re-optimized the EA is in-sample data. Even an honest developer who fixes a losing quarter and re-exports the .set file folds that quarter into hindsight. Across our published third-party Test Reports, this pattern shows up repeatedly:
- Frequent trailing and entry rewrites: Ghost Scalper MT5 launched on
10 August 2026and shipped17updates by late October, withv5.0(13 October 2026) revising entry and trailing logic. Our 34-month run (2024.01.01–2026.10.21,4,967trades,PF 1.63) was profitable, yet nearly every trade occurred beforev5.0existed. - Late-cycle parameter re-optimization: in our My AI Gold MT5 check, changelog entry
v1.51(24 September 2026) explicitly noted re-optimized settings. That meant almost the entire December 2020–October 2026 window sat inside the developer’s lookback mirror, leaving just26post-listing trades on the Conservative set and24on the Prop set — far too small a sample to confirm out-of-sample durability. - Freshly fitted filter profiles: Lizard EA MT5 published on
9 May 2026and went through roughly30updates up tov2.1on4 October 2026, leaving only62post-v2.1trades inside a7,605-trade backtest.
An in-sample backtest does not automatically mean an EA is worthless — it means the six-year screenshot proves code execution and historical fit, not predictive edge. Treat only trades closed after the latest logic or preset update as genuine out-of-sample evidence.
Red Flag 2: Hour Filters and Calendar Skips Tuned to Historical Losses
Session filters make sense when they reflect market structure. Blocking M1 scalping entries between 23:50 and 01:05 server time avoids daily rollover spread blowouts. Pausing breakout stops around US Non-Farm Payrolls or CPI releases avoids thin order books. You can state the execution reason in one sentence before looking at a single backtest.
Curve-fitted time filters work backward. The author runs a six-year test, opens the Entries by hours and Entries by weekdays histograms in the Strategy Tester Report, and switches off every hour slot whose historical Profit Factor fell below 1.0. In our Lizard EA MT5 review, the listing openly stated that its hour filter blocks hours that posted a profit factor under 1.0 “in the historical evaluation,” and v2.1 added a New hour profile “based on fresh data analysis.” Removing past losing hours mechanically lifts historical Profit Factor and trims historical drawdown, but unless Tuesday at 10:00 has a structural reason to lose in 2027, the filter only deleted yesterday’s bad luck.
The extreme version of calendar fitting is hard-coded date blackouts inside compiled .ex5 binaries — skipping March 2020 COVID liquidation weeks, specific central-bank surprise days, or the worst drawdown month of 2023. You cannot inspect compiled code directly, so check the Deals list across major volatility shocks: if a high-frequency EA that normally fires twenty times a week goes completely silent during the exact two weeks gold crashed $200 — without an enabled news or volatility input explaining why — assume the dates were patched out after the fact.
Red Flags 3–4: M1 OHLC Recipes and Discarded Real-Tick Headers
Red Flag 3: Vendor “Test Recipes” That Insist on 1 minute OHLC
Whenever a marketplace listing tells buyers to test specifically in 1 minute OHLC (or Open prices only) while the EA itself manages break-even steps, tight trailing stops, or pending stop grids inside the bar, stop and ask why.
As MetaQuotes documents under Tick Generation Modes, 1 minute OHLC feeds the EA just four synthetic price points per M1 bar (Open, High, Low, Close) along a smooth deterministic path. If an EA evaluates break-even or trailing stops on every tick, four orderly points per minute strip away the intrabar noise that whipsaws tight stops on a live feed.
Our Gold Beaver MT5 report illustrates how wide that gap can get on XAUUSD M15:
- Seller-recommended
1 minute OHLCrun (Run A, Jan–Oct 2026): turned$1,000into$3,311.77(+$2,311.77net profit,PF 2.90,90.95%win rate across221trades), with break-even evaluated on every tick producing146small stop-locked winners out of201winning trades. Yet the report header simultaneously logged0% History Qualityand tick-volume errors across291,087of294,988minute bars. - Tick-level diagnostic (
Run R0, Oct 2026): when tested against mixed real/generated ticks rather than pure M1 OHLC bars, the result flipped to−$105.98with a0.30profit factor and a56.52%win rate across23trades.
Only strategies that genuinely check signals and modify stops strictly once per closed bar behave identically on OHLC and tick modes. If an EA trails intrabar or stacks pending stop orders near current price, read our breakdown in MT5 Modeling Quality Explained and insist on real-tick verification.
Red Flag 4: Believing the Report Header Without Auditing the Tester Journal
Many buyers know enough to select Every tick based on real ticks in the Strategy Tester dropdown and check the green bar at the top of the HTML report. Fewer realize that the report header can print History Quality: 100% real ticks even when the Strategy Tester threw away every single minute of real broker ticks and substituted synthetic generated ticks instead.
In our Scalping Robot Pro MT5 test (v7.1 on XAUUSD M1), Run 1 requested Every tick based on real ticks on Exness-MT5Real7. The exported report summary displayed History Quality: 100% real ticks. Opening the Strategy Tester Journal tab told the exact opposite story: the terminal discarded all 144,033 minutes of real ticks for M1 bar mismatches (and 351,814 of 351,819 minutes in full-year 2025 Run 3), quietly falling back to four-tick-per-minute generated prices. (That particular scalper still lost −$905.11 of a $1,000 deposit inside four trading days even on smooth synthetic ticks, then logged 88,725 "Not enough money" order refusals through October because its equity stop guards shipped at 0.)
Even when real ticks are not discarded wholesale, broker servers rarely store deep multi-year tick archives back to 2018 or 2020. On six-year XAUUSD runs, real-tick coverage in our bench was only 4%–7% on My AI Gold MT5, 15% vs 70% across two runs of Lizard EA MT5, and 28% over 34 months on Ghost Scalper MT5. Always open the Journal after every run and search for three exact strings: real ticks discarded, tick volume errors, and not synchronized.
Red Flags 5–6: Compounding Scale Masks and Unverifiable Cloud Filters
Red Flag 5: Exponential Auto-Lot Curves Hiding Multi-Year Flat Regimes
Turning on percentage-of-balance sizing (Risk = 2% or floating balance multipliers) on a five-year backtest distorts two things at once: it compresses early-year drawdowns into invisible flat lines at the bottom left of the chart, and it weights 80% of Total Net Profit and Profit Factor onto the final twelve months when lot sizes were ten times larger.
Strip compounding out and the real edge trajectory often looks completely different:
- Rescaling a compounded breakout curve (Lizard EA MT5):
Run 2(Highpreset,1%balance sizing from0.01to0.17lots) grew$1,000to$17,469.06with a2.27profit factor. When we rescaled all7,605deals to a flat0.01lot after$0.04commission, the EA earned+$1,493in its first seven months (Dec 2020–Jun 2021), then crawled to just+$962across the next four and a half years (Jul 2021–Dec 2025) — roughly$0.15net per trade before live slippage — including a402-day stagnation stretch without a new balance peak from August 2024 to September 2025. - Nine-month flat regimes inside profitable totals (Ghost Scalper MT5): because we forced all four sub-strategies to a flat
0.01lot across all9,934deals, a245-day flat stretch stood out plainly on the equity graph: between July 2024 and March 2025, the EA took1,544trades for−$56.41(PF 1.02) before resuming its climb in April 2025. - Unfillable 200-lot endpoints (My AI Gold MT5): on the
Aggressivepreset (~26%balance risk per trade), compounding produced a headline$49.6 millionend figure by scaling up to200lots per trade — while visually flattening a 2022–2023 collapse that wiped out90.24%of the balance (92.76%max equity drawdown) and stayed underwater for477days. Compare how MT5 records dollar vs percentage drops in Absolute vs Relative Drawdown in MT5 and How to Read an MT5 Strategy Tester Report.
Red Flag 6: Server-Side “AI” or News Filters and Deposit-Padded Live Signals
MetaTrader 5 purposefully blocks WebRequest() network calls inside the Strategy Tester so backtests remain isolated and repeatable (unless a developer ships an offline historical event file embedded as a resource). That architectural rule creates a convenient blind spot for commercial listings.
When a $1,599 listing headlines a server-hosted “AI Geopolitical Filter” monitoring social media alongside a live calendar feed — as in Scalping Robot Pro MT5 — neither feature executes inside the Market demo you download. If the demo loses money in the tester, a seller can blame the missing cloud filter; if the demo wins in the tester, the cloud filter had nothing to do with the result.
Sellers often bridge that gap by linking a public live signal. Before trusting a signal badge, check three lines below the growth percentage: Account opened date, Initial deposit vs subsequent Deposits/Withdrawals, and Average Win vs Average Loss. In our Scalping Robot Pro MT5 audit, the linked signal displayed +34.17% growth on a $4,032.25 balance — alongside $8,318.55 in total deposits, $7,415 in withdrawals, and an account opened three weeks earlier while displaying an “8 weeks” age badge. Cash-flow movements mid-run can distort headline growth math without proving strategy expectancy.
Red Flag 7: Parameter Cliffs and Built-In MT5 Forward Validation
A genuine market inefficiency sits on a parameter plateau: if a breakout window works with a 20-bar lookback and a 400-point stop, it usually stays modestly profitable at 18 or 22 bars and 360 or 440 points. An overfitted parameter set sits on a needle spike: Period = 19 and SL = 385 yields PF 2.60, while Period = 21 and SL = 420 drops to PF 0.92 because a handful of oversized gold candles flip from winners to stop-outs.
Before trusting your own optimization pass or a commercial .set file, run this four-step validation routine in the Strategy Tester:
- Lock lot sizing to a flat
0.01lot first: load the preset cleanly (follow How to Use, Save and Audit MT5 .set Files so leftover values do not mix), then switch every auto-lot orRisk %toggle off. Equal lot size exposes year-by-year edge decay and long stagnation stretches immediately. - Enable MT5’s built-in
Forwardsplit whenever optimizing: in Strategy Tester Settings → Forward, select1/2,1/3, orCustom(for commercial EAs, set theCustomforward date to the version’s release date). MetaTrader 5 optimizes strictly on the back segment, then automatically re-runs the top passes once across the untouched forward segment. On the Optimization Results X/Y graph, robust rules cluster in the upper-right quadrant (positive in both Back and Forward); overfitted passes line up high on the Back axis and below zero on the Forward axis. - Run a
±10%neighbor perturbation test: take the candidate preset and manually nudge its exposed stop-loss, take-profit, trailing start, and indicator lookback inputs up and down by10%–15%across four single runs. If a10%nudge cutsProfit Factorin half or collapses trade count, the preset is sitting on a curve-fitted cliff. - Cross-check on a second symbol feed or broker archive: run the exact same flat-lot preset on a second raw-spread broker server (for instance, comparing two independent
XAUUSDfeeds) and verify in theJournalthat real ticks actually loaded without mass discards. An edge that vanishes when broker tick quotes differ by two points will not survive live execution.
Where to Go Next
- How to Read an MT5 Strategy Tester Report, Line by Line — how to audit Expected Payoff, Recovery Factor, and Z-Score alongside Profit Factor
- MT5 Modeling Quality Explained — when M1 OHLC is honest and when generated ticks invent intrabar profits
- Absolute vs Relative Drawdown in MT5 — how compounding and high starting balances hide monetary vs percentage losses
- Why a Good MT5 Backtest Dies Live — the 1×, 2×, and 3× spread plus delay stress test for EAs that pass your overfitting audit
- How to Use, Save and Audit MT5 .set Files — how to inspect UTF-16LE presets and optimization step columns before testing
- How to Spot Hidden Grid and Martingale Logic in an MT5 Backtest — how to verify basket exits and post-loss lot sizing in the Deals table
- How We Test — the exact Strategy Tester disclosure rules behind every AlgoToolbox report
FAQ
How can I tell if an MQL5 Market EA backtest is overfitted without seeing the source code?
Check four things you can observe from outside the compiled .ex5: compare the test window against the latest parameter-changing date in the product’s What's New log, run a flat 0.01-lot test across years to look for multi-month stagnation or collapse outside one lucky regime, perturb exposed stop/trailing/session inputs by ±10%, and inspect the Deals list during major historical crashes to verify the EA did not mysteriously pause on hard-coded dates.
Does MT5’s Forward testing mode prevent MT5 backtest overfitting?
It catches first-pass curve-fitting, provided you only look at the Forward segment once. If you inspect the Forward results, discard the settings that failed Forward, tweak your indicator filters, and run Forward again on the same dates, that Forward window becomes in-sample data too. Keep one final untouched date window — or live 90-day demo forward data — completely out of your tuning loop.
Why does an MT5 report say 100% real ticks when the Journal says real ticks were discarded?
When archived broker ticks conflict with the symbol’s M1 bar history (for example after history synchronization gaps or spread/volume mismatches), the Strategy Tester logs real ticks discarded in the Journal and substitutes synthetic generated ticks for those minutes, even though the HTML report header may still print 100% real ticks. Always search the Journal tab before trusting the header badge.
Why should I always disable auto-lot compounding when checking an EA for curve-fitting?
Compounding weights late-period trades ten to fifty times heavier than early-period trades. An EA that went sideways for three years and caught one strong six-month gold trend at the end of the test can still post an impressive compounded Profit Factor and exponential dollar curve while hiding early drawdowns inside tiny initial lot sizes. Flat 0.01-lot testing gives every month equal weight.
How many out-of-sample trades are enough after an EA’s release date?
Twenty or thirty post-release trades only confirm that the EA places and closes orders without runtime errors; a single quiet month can flatter or hurt a 25-trade sample by chance. Look for at least 150–300 out-of-sample trades spanning both trending and range-bound weeks — or run the EA on your target broker’s demo account for at least 90 days — before committing meaningful live capital.
Risk & Transparency Notice: All indicators, scripts, and backtest results on AlgoToolbox are for educational and testing purposes only. Trading Forex, CFDs, and cryptocurrencies carries significant financial risk. Past performance does not guarantee future results. Read our full Risk Disclaimer.