How to Test If an MT5 Indicator Repaints (Visual Tester & Code Checks)
wo practical ways to catch indicator repainting in MetaTrader 5: step-by-step Visual Mode replay for compiled .ex5 files and four .mq5 source checks.
When you want to test if an MT5 indicator repaints before trusting its signals with live money, static screenshots on a product page tell you nothing. Any arrow or zone tool looks surgical on historical candles if the code revises past bars after price moves, or erases failed setups whenever the chart refreshes.
You can verify how any MetaTrader 5 indicator behaves in about fifteen minutes, even when a seller distributes only a compiled .ex5 binary. When you also have the .mq5 source code, four quick checks inside MetaEditor reveal the exact bar-indexing behavior before you ever attach the file to a chart.
On this page8 sections
- Three Different Behaviors Traders Call “Repainting”
- Concrete Examples Across Published MT5 Indicators on This Site
- Method 1: Testing a Compiled .ex5 in Strategy Tester Visual Mode
- The Refresh and Re-Attach Acid Test
- Method 2: Four Source-Code Checks in an .mq5 File
- Higher-Timeframe Leaks, Plot Shifts, and Chart Object Rewriting
- Where to Go Next
- FAQ
Three Different Behaviors Traders Call “Repainting”
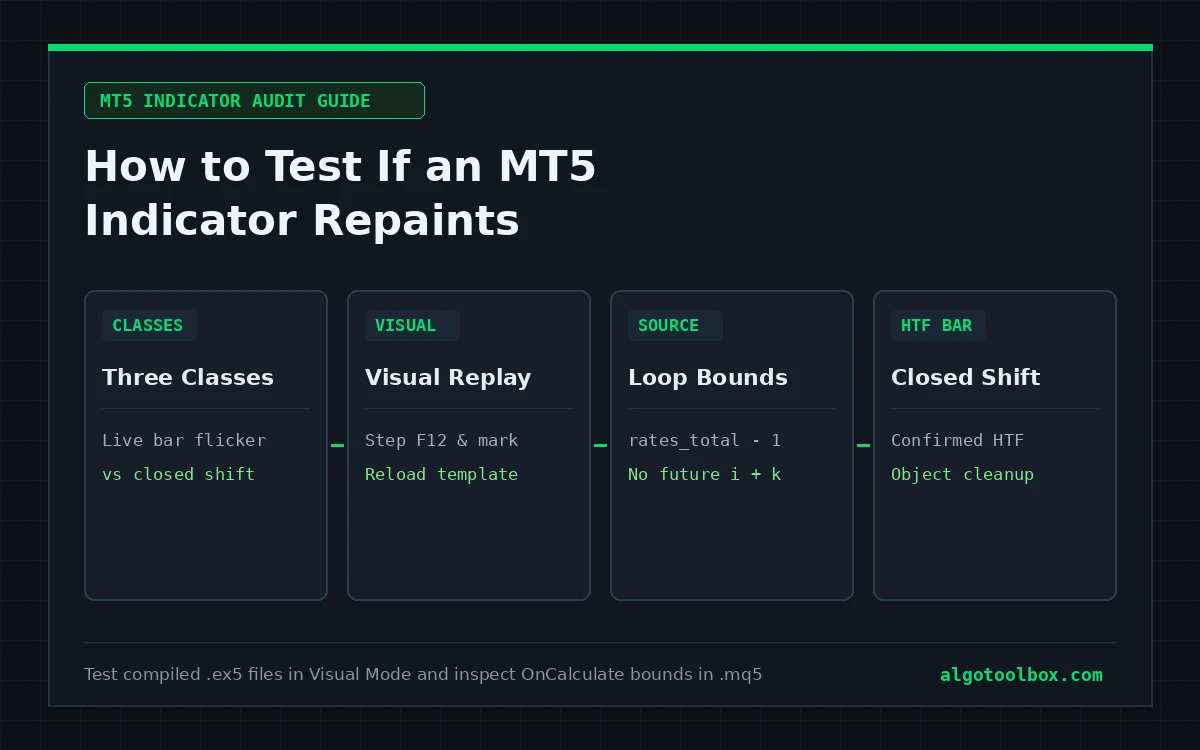
Before opening the Strategy Tester, separate three distinct mechanisms that get lumped together on trading forums. Only the third is true historical repainting, whereas the first two are normal calculation choices that simply dictate when you are allowed to act on a signal:
| Behavior class | What changes on the chart | Typical MQL5 mechanism | What it means for execution |
|---|---|---|---|
| 1. Forming-bar recalculation | Arrows, labels, or oscillator values appear and vanish on the currently open candle, then lock permanently once that candle closes. | Evaluating the live bar (rates_total - 1 in chronological order, or shift 0 in series order) on every tick. |
Safe only if you wait for candle close before acting; dangerous if intrabar alerts trigger early entries. |
| 2. Confirmed delayed pivots | A swing marker is drawn N bars back on the actual high or low, but only after N right-hand bars have closed to confirm the turn. |
Checking i - swingLen once bar i closes (such as MT5 Fractals or 5-bar swing pivots). |
Deterministic structure, not an entry at the pivot tip — your earliest real-time awareness arrives at bar pivot + N. |
| 3. True historical repainting | Arrows, lines, or boxes on already closed bars move, flip direction, or disappear several candles later (or upon chart refresh). | Future subscripts (i + k), unclosed HTF CopyBuffer reads, centered smoothing windows, or ObjectDelete() cleanup. |
Unusable for systematic entries or visual backtesting; historical charts manufacture hindsight accuracy. |
Notice why Behavior #2 misleads anyone scrolling left on a static screenshot: a confirmed 5-bar swing high sits directly above the exact turning candle, making it look as if the indicator called the top on that bar. In real time, that label did not exist until five full candles later. Replaying tick history makes that five-bar confirmation lag unmistakable within two minutes.
Concrete Examples Across Published MT5 Indicators on This Site
Even among open-source indicators with zero future-data leaks, bar-close timing, pivot delay, and chart-object updates differ by design. Here is how six published indicators on AlgoToolbox handle those boundaries in practice:
| Indicator | Forming-bar vs closed-bar state | Pivot / HTF / object nuance to know |
|---|---|---|
Absorption Radar MT5 (v1.00) |
Main signal loop stops at rates_total - 2; the forming candle never plots an entry arrow. |
Alerts fire once per newly closed candle (time[i] != gLastAlertBar). |
Liquidity Hunter MT5 (v1.00) |
Evaluates completed bars only (i < rates_total - 1). |
Default Swing Length = 5 means swing highs/lows confirm five bars after the pivot; BOS and entry signals fire on the later break candle. |
Streak Reversal Indicator (v1.00) |
Provisional on the forming bar: current-bar labels and signal buffers (8–11) recalculate on ticks until the candle closes. |
Keep InpAlertsOnBarClose = true and read shift 1 (last completed bar) if calling via iCustom / CopyBuffer. |
Reaction Level Matrix MT5 (v1.02) |
Commits rejection arrows and virtual SL/TP buffers (4–5) strictly on completed bars. |
Pivots need Swing Length = 6 right-hand bars; support/resistance band objects adjust center/width as new pivots merge within 0.6 × ATR. |
FVG Sniper MT5 (v1.02) |
Evaluates three-candle gaps and rejection closes on completed bars. | Optional H4 EMA 50 filter uses MT5’s confirmed-HTF bar rather than the unclosed higher-timeframe candle. |
DiNapoli Levels MT5 (v1.00) |
Evaluates completed bars after 5-left / 5-right ABC pivot confirmation. |
The 3×3 displaced SMA shifts its line forward visually via PLOT_SHIFT, while the filter reads an earlier trailing SMA value (not future bars). |
Method 1: Testing a Compiled .ex5 in Strategy Tester Visual Mode
When a commercial or freeware indicator only ships as a compiled .ex5 file, you cannot inspect its loop bounds in MetaEditor. Instead, replay historical ticks inside MetaTrader 5’s Strategy Tester Visualization window and log what happens as candles form and close.
- Launch Strategy Tester in Indicator mode: press Ctrl+R, select Visualize (or pick Indicators from the Strategy Tester start screen), choose the custom indicator from the dropdown, and select an active symbol and timeframe such as
XAUUSDM5 or M15 over a recent one-week window. - Use tick-level modelling: set Modelling to Every tick based on real ticks (or Every tick if your broker server has no recent tick archive — see MT5 modeling quality and History Quality). Do not use Open prices only, which skips intrabar tick updates entirely.
- Open the Data Window inside the visual terminal: once the visual chart opens, press Ctrl+D so you can watch exact numeric values inside every plot buffer rather than relying on small chart arrows alone.
- Pause and step forward with
F12: lower the replay speed slider, pause as soon as a signal arrow or zone appears, and drop a vertical line (Insert → Lines → Vertical Line) on that exact candle. Note two facts: whether the arrow appeared on the live open candle (rightmost bar) or on the just-closed candle (one bar left), and the exact buffer value shown in Ctrl+D. - Play through 30 to 50 bars of adverse price movement: advance the replay through a sharp move against that signal. Inspect every vertical marker line you dropped earlier. If an arrow sitting two, five, or fifteen closed bars to the left vanishes, jumps to a neighboring candle, or flips its Data Window buffer back to empty, the indicator is rewriting closed history.
The Refresh and Re-Attach Acid Test
Stepping forward catches live loop mutations, yet a second MQL5 bug can still slip past a casual visual watch: divergent full-recalculation vs live-tick code paths. Inside OnCalculate(), an author can accidentally (or deliberately) run different logic when prev_calculated == 0 (initial history load, when subsequent bars already sit in memory) versus when prev_calculated > 0 (incremental live ticks).
Run this two-minute reload check before signing off on any closed-source .ex5 indicator:
- Keep your vertical marker lines on the chart after recording 10 to 15 live or visual-mode signals, and capture a quick screenshot of the window.
- Right-click the chart and click Refresh — or open a regular chart over the exact same symbol, timeframe, and date window and attach a fresh copy of the indicator with identical inputs.
- Compare every signal arrow and Data Window buffer value against your vertical lines and screenshot.
On a deterministic closed-bar indicator, a freshly attached chart reproduces the exact same arrows on the exact same candles that appeared bar-by-bar during live replay. If reloading the indicator makes losing live signals vanish or inserts textbook turning-point arrows that never fired while you stepped forward with F12, the historical initialization pass is reading ahead.
Method 2: Four Source-Code Checks in an .mq5 File
When you have the .mq5 source file (for instance, installed via how to install a custom MT5 indicator from GitHub), press F4 to open MetaEditor and inspect four places inside OnCalculate():
Check 1: Confirm whether arrays are chronological or series-indexed
Press Ctrl+F and search for ArraySetAsSeries:
- Chronological order (MQL5 default when
ArraySetAsSeriesis false or absent): index0is the oldest bar in chart history,rates_total - 2is the most recently closed candle, andrates_total - 1is the live forming candle. - Series order (
ArraySetAsSeries(..., true)): index0is the live forming candle, index1is the most recently closed candle, andrates_total - 1is the oldest bar.
Check 2: Inspect the loop boundary and start index
An indicator that commits signals strictly on completed candles stops one index short of the forming bar. Here is the exact chronological loop pattern from AbsorptionRadar.mq5 and LiquidityHunter.mq5:
// Chronological arrays: 0 = oldest bar, rates_total - 1 = forming bar
int start = (prev_calculated <= 0) ? lookback : prev_calculated - 1;

// Stop at rates_total - 2 (the last CLOSED candle)
for(int i = start; i < rates_total - 1; i++)
{
   // Signal math uses only bar [i] and older bars [i - k]
   if(live && i == rates_total - 2 && time[i] != gLastAlertBar)
   {
      gLastAlertBar = time[i]; // Alert once when the candle closes
   }
}
By contrast, if a loop resets start = rates_total - 200; on every incoming tick and overwrites buyBuffer[i] across the last 200 closed bars, historical signals remain mutable long after those candles closed.
Check 3: Scan array subscripts for future-bar offsets
Check every subscript inside the calculation loop on open[], high[], low[], close[], and helper buffers:
- In a chronological array (
0= oldest), readinghigh[i + 1]orclose[i + 4]while writing a signal intobuffer[i]accesses future candles that did not exist when bariclosed. - In a series array (
0= newest), readingclose[i - 1]orlow[i - 3]while writing intobuffer[i]is the exact same lookahead bug in the opposite direction.
Check 4: Look for centered smoothing loops
Search for symmetric averaging windows — often labeled TMA (centered Triangular Moving Average), SSA, or loops running for(int k = -half; k <= half; k++). In the middle of history, symmetric windows average past and future bars into a smooth curve; at the live right edge, the missing future half is approximated with current prices and continuously bent upward or downward over the next half bars.
Higher-Timeframe Leaks, Plot Shifts, and Chart Object Rewriting
Three subtler MQL5 mechanics frequently trigger confusion when auditing multi-timeframe and structure indicators (see also porting a TradingView indicator to MT5):
- Unclosed higher-timeframe reads via
CopyBuffer(): sixteen M15 bars sit inside one H4 bar. If an M15 indicator reads shift0of an H4 EMA and paints all sixteen M15 candles with the H4 bar’s final closing state on reload, up to three hours and forty-five minutes of M15 signals can flip retroactively when a chart refreshes. Non-repainting multi-timeframe gates map each lower-timeframe bar to the most recently closed higher-timeframe candle. - Visual
PLOT_SHIFTvs lookahead: callingPlotIndexSetInteger(plot, PLOT_SHIFT, 3)(as in an Ichimoku cloud or DiNapoli displaced moving average) shifts a finished historical calculation forward on the screen; it does not read future candles. Conversely, a negative plot shift (such as Ichimoku’s Chikou Span at-26) plots today’s close 26 bars to the left for visual comparison and cannot be read at bar-26as if it existed back then. - Chart objects vs indicator buffers: Ctrl+D only inspects arrays bound with
SetIndexBuffer(). Many SMC and zone tools draw boxes and labels viaObjectCreate(),ObjectMove(), andObjectDelete(). Extending the right-hand time edge of an active unmitigated zone or updating a dynamic support band as new pivots arrive is expected; deleting historical entry markers after price hits a stop-loss is history scrubbing.
Where to Go Next
- Need to set up and compile
.mq5source files in the right terminal directory first? Read how to install a custom MT5 indicator from GitHub. - Porting Pine Script indicators where
barstate.isconfirmedandrequest.security()behave differently from MQL5? Check porting a TradingView indicator to MT5: what breaks first. - Want to inspect clean closed-bar MQL5 code and documented chart behavior? Browse all open-source repositories on Our Builds.
FAQ
Is every indicator that flickers on the live open candle broken?
No. Any indicator derived from Close, High, or Low of the forming candle naturally updates with each tick until that candle closes. If you code an Expert Advisor or trade manually, simply read shift 1 (the just-closed candle) rather than shift 0 so intrabar noise never triggers premature entries.
Why do ZigZag and fractal indicators plot markers several bars late without being defective?
A swing high cannot be proven to be a local peak until price either reverses by the ZigZag threshold or prints N lower highs to its right. Those markers are structural labels confirmed with a known delay, not real-time entry arrows at the extreme candle’s high or low.
Can I run this Visual Mode repaint check on a paid MQL5 Market indicator before buying?
Yes. Every MQL5 Market indicator offers a free Strategy Tester demo that runs inside MT5 Visualization. Step through a volatile session with F12, drop vertical lines on printed signals, advance 30–50 bars, and refresh the chart to verify closed-bar stability before spending anything.
Why does Data Window show EMPTY_VALUE or blank cells on non-signal candles?
Arrow buffers in MQL5 store EMPTY_VALUE (DBL_MAX, or 0.0 if configured via PLOT_EMPTY_VALUE) on bars with no signal, and store a real price level only where an arrow prints. If a closed bar (bar 1 or older) shows a price in Ctrl+D and reverts to blank several candles later, that buffer value was overwritten retroactively.
Does testing on “1 minute OHLC” hide indicator repainting?
It hides intrabar tick flickering inside one-minute candles, though it still catches multi-bar lookahead bugs (i + k offsets, unclosed HTF reloads, and centered averages). Use Every tick based on real ticks over a short recent window so you see both intrabar and multi-bar behavior accurately.
Risk & Transparency Notice: All indicators, scripts, and backtest results on AlgoToolbox are for educational and testing purposes only. Trading Forex, CFDs, and cryptocurrencies carries significant financial risk. Past performance does not guarantee future results. Read our full Risk Disclaimer.