Streak Reversal MT5 Port
Streak Reversal MT5 port explained: candle streaks, EMA categories, live checklist, reference TP/SL levels, and limits. Read the settings guide.
One green check mark is a small but dangerous source of confidence. Our eyes find it, feel pleased, and become surprisingly forgiving toward the three crosses beside it. A checklist is supposed to prevent that sort of negotiation.
Streak Reversal MT5 brings that checklist to a candle pattern: a same-color streak, two candles in the opposite direction, and a confirmation close. Separate LONG and SHORT columns show what passes, what fails and what is still waiting. A turn can look promising without qualifying, and the panel helps explain the difference.
On this page12 sections
- Test Bench
- What the Streak Reversal Indicator Does
- How It Generates Long and Short Signals
- Inputs and Defaults
- Chart Evidence and Test Scope
- Limitations and Known Issues
- How the Streak Reversal Indicator Compares
- Step-by-Step MetaTrader Installation Guide
- Advantages and Disadvantages
- Source, Licence and Distribution
- Frequently Asked Questions
- Final Verdict
Test Bench
| Specification | Our configuration |
|---|---|
| Platform | MetaTrader 5 |
| Tool type | Indicator |
| Version tested | 1.00 |
| Symbol / timeframe | XAUUSDc, BTCUSDc M5, M30, H4 |
| Test period | 2026-09-24 → 2026-09-27 (reported visual-review window) |
| Data / tick mode | Live demo chart, every tick | not stated in the source material |
Start there, then check whether the signal candle has actually closed. Trend and Counter describe the setup’s position relative to the EMA. The entry, stop and target lines help illustrate a plan. None of them places a trade for you.
What the Streak Reversal Indicator Does
We adapted Streak Reversal by Uncle_the_shooter for MT5. Version 1.00 draws a two-color EMA, pattern labels, optional shapes, reference levels and a LONG/SHORT checklist. It doesn’t submit orders or manage broker positions.
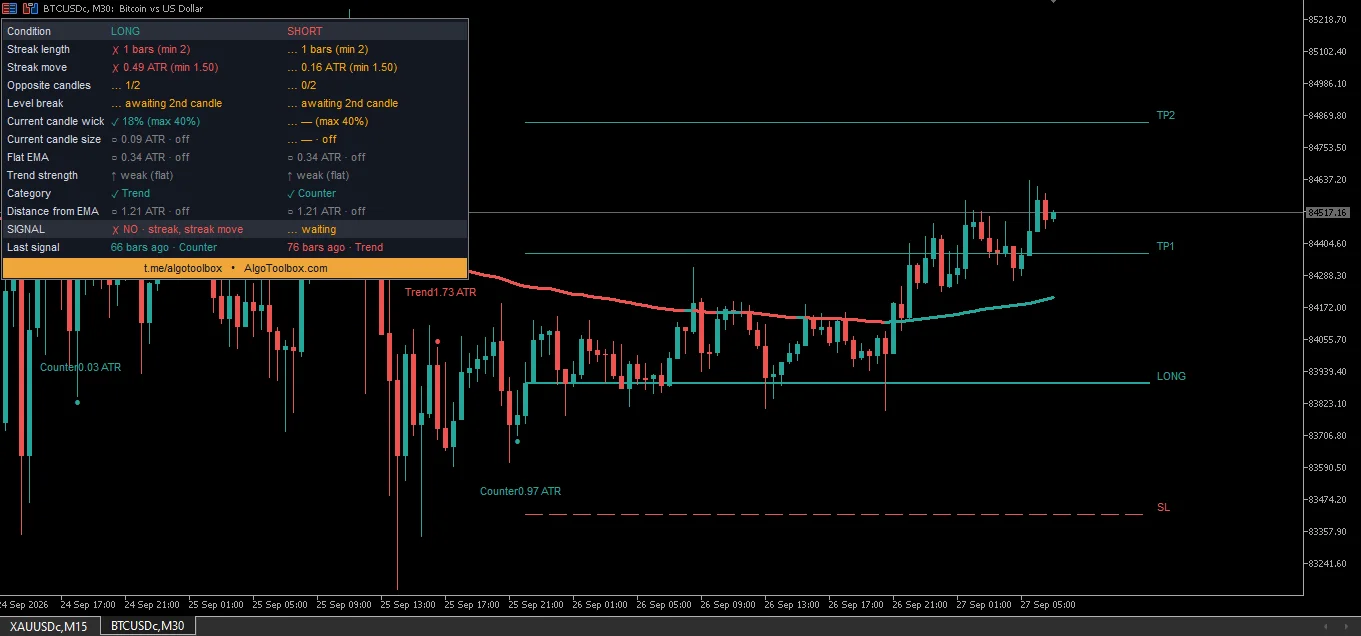
Read the two columns separately. A check mark means a condition passes, a cross identifies a blocker, an ellipsis means waiting, and a circle marks a disabled filter. Not every row needs to turn green: trend strength is information rather than a requirement, and a filter marked off can’t reject the setup.
Figure 1 is a good example. The LONG wick is within its limit, but the original streak has only one candle against the required two, and its move is too small. The passed wick check doesn’t cancel those failures. Reference lines from an earlier signal can still be on the chart while the current candidate has work left to do.
A label such as “Trend 1.73 ATR” also needs a little decoding. It gives the setup category and the signal close’s distance from the EMA, measured in ATR units. ATR provides a volatility reference. The label doesn’t mean the trade earned 1.73R, or that the preceding streak moved 1.73 ATR.
How It Generates Long and Short Signals
Pattern formation and confirmation
For a long, the sequence starts with bearish candles followed by two bullish candles. For a short, turn that around. The two reversal candles don’t count toward the original streak, and a doji breaks a same-color run. By default, that original run needs at least two candles and enough displacement to pass the ATR filter.
- Direction and streak: the direction must be enabled, with at least two same-color candles by default.
- Streak displacement: the default gate requires a move of at least 1.5 × ATR(100), using ATR at the streak’s final candle.
- Opposite candles: two bullish candles must follow a bearish streak, or two bearish candles must follow a bullish streak.
- Confirmation break: the second opposite candle must close beyond the first one’s selected body edge or high/low.
- Other filters: the candidate still needs to pass the wick rule, allowed category and any enabled size, EMA-movement or EMA-distance filters.
- Output: qualifying conditions produce signal flags and labels. A completed-bar signal can create a new set of reference levels.
The displacement calculation isn’t simply the sum of candle bodies. For a bearish streak, it takes the first bearish candle’s high minus the final bearish candle’s low. For a bullish streak, it takes the final bullish candle’s high minus the first bullish candle’s low. That distance is divided by ATR at the streak’s final candle. Two candles can therefore pass the count and still fail the movement requirement.
In Body confirmation mode, a long needs a close above the first bullish candle’s body top; a short needs a close below the first bearish candle’s body bottom. High/Low mode uses the full high or low instead. The wick rule checks the signal candle’s upper wick for longs and lower wick for shorts, as a share of its complete range.
Suppose, as a hypothetical long example, two bearish candles pass the streak requirements. A bullish candle follows, then another bullish candle closes above the first bullish body’s top. The basic Body-mode sequence is there. But the second bullish candle must still pass the wick check and every other enabled filter. A quick poke above the level before the candle closes isn’t the same thing.
EMA category is not EMA slope
A long above EMA 100 is Trend. A short below it is also Trend. The remaining cases are Counter, including a close exactly on the EMA. These names describe which side of the average the signal occupies; they don’t require the EMA to slope in the trade’s direction.
The separate EMA-movement reading looks at the average’s highest-to-lowest range over its window, expressed in ATR units. It can help identify a relatively flat average, but it doesn’t measure directional slope either.
The flat-EMA filter is off by default, even if its row shows a number. Switch it on, and it requires at least 0.50 ATR of EMA range over 20 bars. The 1.0 and 2.5 ATR strength thresholds label strong and very strong movement; they aren’t extra entry gates. EMA distance is a separate calculation: absolute close-minus-EMA, divided by the selected ATR.
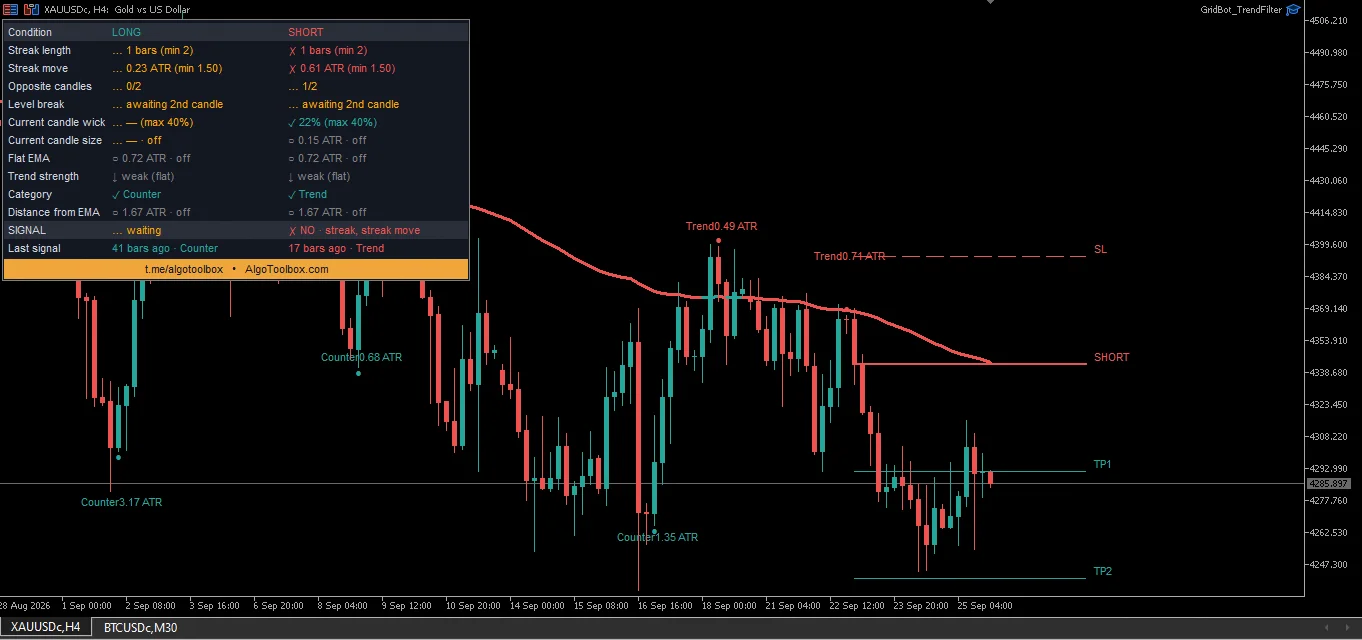
Reference levels and signal timing
The confirmed signal close becomes the reference entry. The default stop distance is 1.5 × ATR(14). The alternative percentage mode uses 1% of entry price rather than 1% of account equity. TP1, TP2 and TP3 sit at 1R, 2R and 3R from entry, where 1R is the reference entry-to-stop distance.
Those lines illustrate price distances. They don’t size a position, close part of it, trail a stop or protect anything at the broker.
An active reference set projects 12 bars forward. When a later completed bar reaches the stop or furthest enabled target, the set’s endpoint freezes. TP1 alone doesn’t necessarily finish it. Hide TP3, and TP2 can become the terminal target. The lines stay visible afterward, and a new confirmed signal can replace them.
This is why timing matters more than a tidy-looking label. While the second opposite candle is forming, the checklist, category, labels and signal buffers can change on each tick. Wait for its close before treating the signal as confirmed.
There’s one more timing detail: the optional first-opposite-candle marker is drawn one bar back after the setup qualifies. It points to part of the pattern; it doesn’t mean the completed signal was already available on that earlier candle.
Inputs and Defaults
These are version 1.00’s code defaults, not an optimized trading preset. A threshold beside a disabled filter does nothing until that filter is enabled. The screenshots also aren’t a complete settings record for each chart.
| Input group | Default | What it controls |
|---|---|---|
| Directions / Categories / Min Streak | Long, Short, Trend, Counter true; 2 candles | Allowed signal families and the preceding run length. |
| Streak move | Filter true; 1.5 × ATR(100) | Minimum preceding displacement, separate from candle count. |
| Confirmation / Wick | LVL_BODY; wick filter true; maximum 40% | Confirmation beyond the first opposite body, with a limit on the second candle’s opposing wick. |
| Candle size | Filter false; SM_BODY; 0.30 × ATR(100) | Optional minimum confirmation-candle size. |
| EMA / Movement / Strength | EMA 100; filter false; window 20; minimum 0.50 × ATR(100); labels 1.0 / 2.5 ATR | Category context, optional flatness gate and informational strength. |
| EMA distance | Trend maximum off, 2.0 ATR; Counter minimum off, 3.0 ATR; ATR 100 | Optional near-EMA Trend or far-from-EMA Counter requirements. |
| Reference SL / Targets | ATR mode true; ATR 14 × 1.5; percentage alternative 1%; targets 1R / 2R / 3R | Reference price distances, not account-risk allocation. |
| Table / Shapes / Alerts | Table true; signal shapes false; alerts false; alert-on-close true | Display and popup timing. Alert-on-close doesn’t stop live calculation. |
Try one optional filter at a time. A stricter displacement rule or an EMA-distance limit will remove some candidates by design. Whether the remaining signals are more useful is another question; a quieter chart doesn’t answer it.
Record the symbol, timeframe, inputs and rejected conditions. That gives you something to compare beyond “this version looks cleaner.”
Chart Evidence and Test Scope
The examples show BTCUSDc M30 and XAUUSDc H4/M5. They’re here to explain how the checklist, historical labels and reference lines fit together. They don’t establish a win rate, expected return or broker execution result.
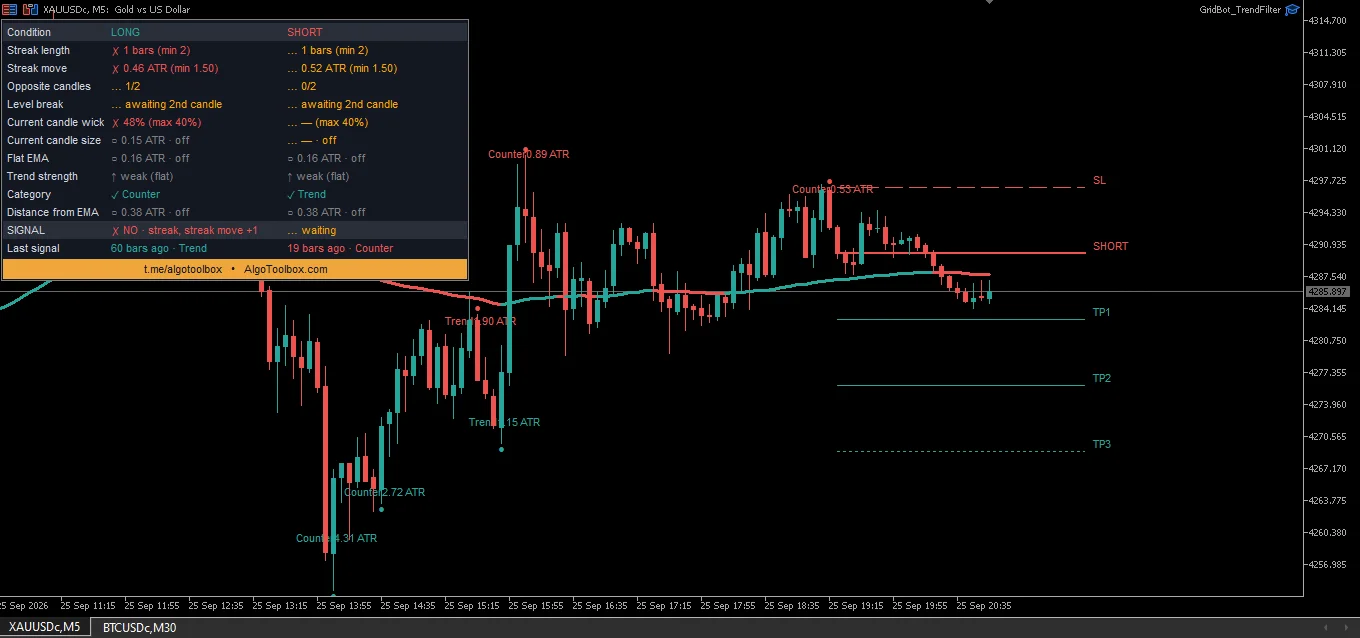
In Figure 3, the LONG upper wick is too large: 48% against a 40% limit. The streak requirements fail too. The short reference lines belong to an earlier setup, not an approval of the current LONG preview. Old lines and a new candidate can share the chart without belonging to the same signal.
| Example | Displayed reading | Where to look | What it shows |
|---|---|---|---|
| BTCUSDc M30 LONG preview | Streak 1 versus minimum 2; move 0.49 versus 1.50 ATR; wick 18% versus 40% | Figure 1 | The wick passes, but the streak requirements don’t. |
| XAUUSDc H4 SHORT preview | 1/2 opposite candles; wick 22% versus 40%; Trend category | Figure 2 | A waiting checklist can coexist with historical reference drawings. |
| XAUUSDc M5 LONG preview | Streak 1; move 0.46 ATR; wick 48% versus 40% | Figure 3 | Several conditions block the candidate, despite visible levels. |
| Combined visual reference | LONG streaks 2 versus 1; EMA distances 0.70 versus 0.38 ATR | Figure 4, upper versus lower panel | The displayed states differ; this isn’t proof of matching calculations on a shared bar. |
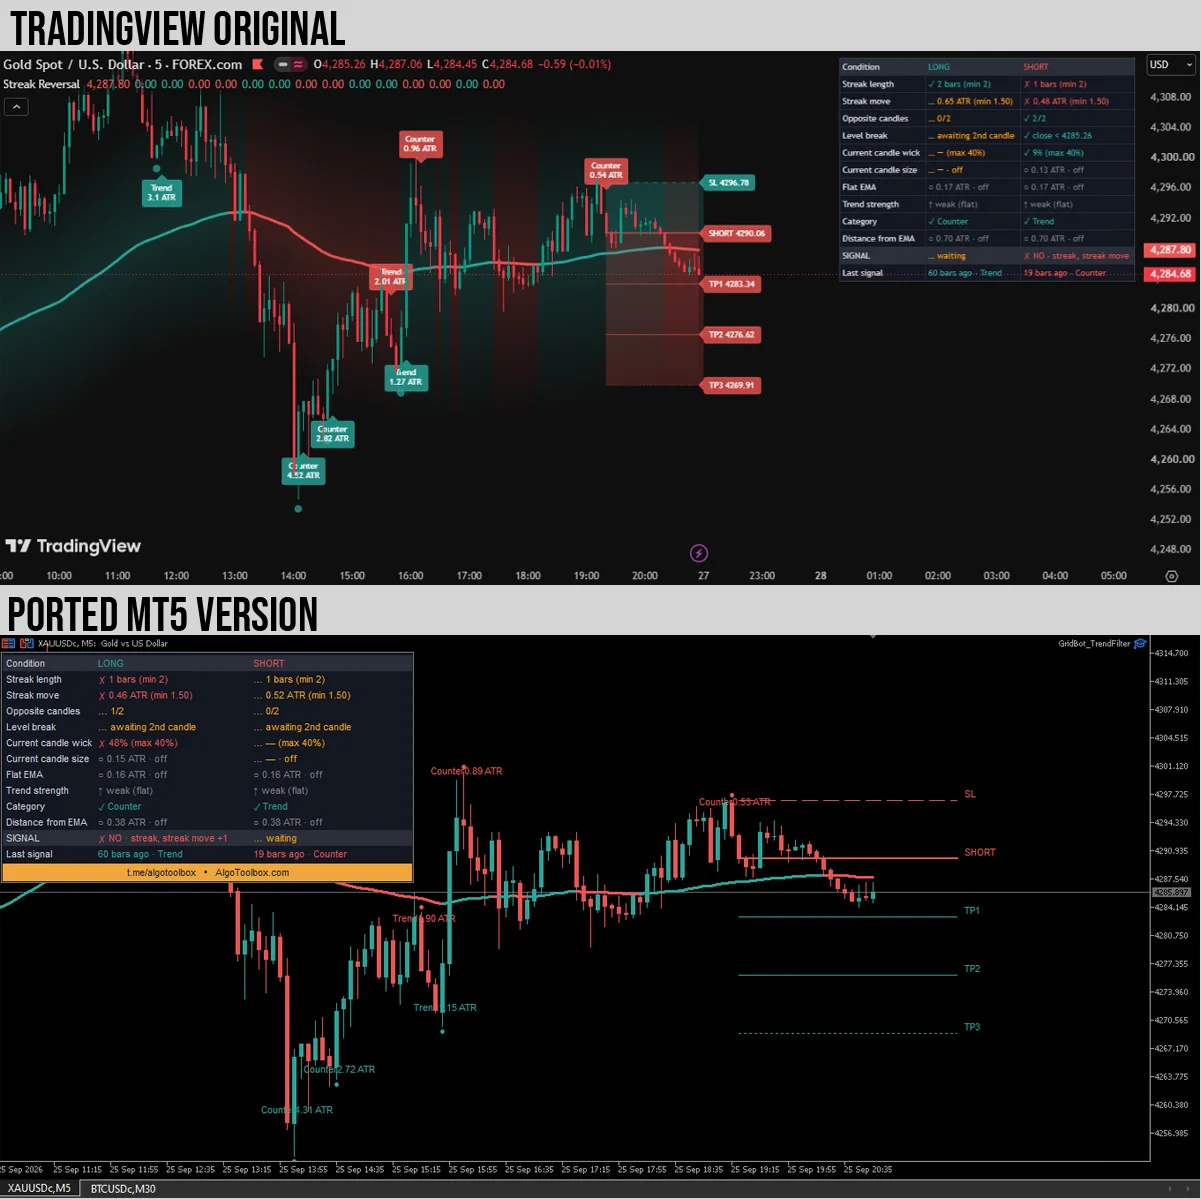
Figure 4 is a layout comparison, not a candle-by-candle parity test. The displayed readings differ. To compare calculations properly, we’d need matching price bars, history, settings and timestamps. No performance backtest or new terminal run is presented here.
Limitations and Known Issues
A qualifying candle pattern isn’t a complete trading strategy. This indicator has no news filter, higher-timeframe gate, position sizing or broker execution model. Around CPI, NFP, FOMC, rollover or thin liquidity, the reference close and stop may not represent attainable fills. A small ATR-based stop can also be unsuitable for the spread or current conditions.
- Warm-up: the default 100-period ATR and EMA calculations need sufficient history. Unavailable early readings aren’t established context.
- Live previews: a current-bar label or 1.0 buffer flag can disappear before the candle closes. Alert-on-close controls when an alert fires, not whether the display recalculates.
- Reference targets: a frozen set of lines doesn’t prove a fill sequence, partial exit, profit or completed account trade.
- Multiple copies: object names are chart-based. Use separate charts when comparing instances.
- Presentation: glow and background effects are omitted. The table sits top-left, with adjustable offsets and small text.
A different broker feed, session gaps, chart history or settings can change the calculation. The examples don’t identify a best timeframe. Choose a filter because it expresses a rule you want to study, then inspect the rejected setups as well as the ones that pass.
This article covers MT5 version 1.00. Higher-timeframe gating and additional notification channels aren’t features of this source version.
How the Streak Reversal Indicator Compares
Reaction Level Matrix looks at clustered swing reactions. FVG Sniper follows three-candle imbalances and their lifecycle. Streak Reversal asks a different question: did a directional run produce the required opposite-candle confirmation?
Choose it when the sequence itself is what you want to inspect: “Has this turn qualified, and what’s still missing?” A level- or gap-focused tool suits a different question about structure. These are different chart views, not a ranking of which one makes more money.
Step-by-Step MetaTrader Installation Guide
- In MT5, open File → Open Data Folder, then
MQL5/Indicators/. - Copy
Streak Reversal Indicator.ex5into that folder. If building from source, openStreak Reversal Indicator.mq5in MetaEditor, press F7 and check the compilation result before using the generated EX5. Keep the filename supplied with your actual release. - Refresh Navigator or restart MT5, then attach one copy to a chart with enough history. Start with defaults and record any changes.
- For popup alerts, enable
InpEnableAlerts. KeepInpAlertsOnBarClose=truefor closed-bar messages. Check Experts/Journal for errors. - On demo, pick a completed signal and follow the candle sequence alongside its checklist. Include failed candidates in your notes before building entry and risk rules around the pattern.
The indicator itself doesn’t require Algo Trading. Version 1.00 uses MT5 popup alerts; enabling email or push in the terminal won’t add channels the code doesn’t implement. Check alert timing separately from any trading plan you develop.
Advantages and Disadvantages
Advantages
- Separate LONG/SHORT checklists make blockers and waiting conditions visible.
- Trend and Counter use explicit EMA-position rules.
- Displacement, wick, size, movement and distance conditions can be inspected rather than guessed.
- Reference stops illustrate price distances without pretending to allocate account risk.
- Four dedicated signal buffers can support a separately specified EA.
Disadvantages
- Forming-bar output can change before the close.
- There is no session/news filter or broker-position management.
- The comparison images don’t establish full numerical parity.
- Enabled targets affect when a reference set freezes; hiding the set doesn’t disable signal calculations.
- Alerts are popup-only in this version.
Source, Licence and Distribution
- Rights
- Open source
- MT5 port by
- Eko Martha Kusumah (AlgoToolbox)
- Original author
- Uncle_the_shooter
- Original work
- Streak Reversal
- Licence
- MPL 2.0
- Version tested
- 1.00
- Tool type
- Indicator
Attribution. Streak Reversal by , licensed under MPL 2.0. MT5 port by Eko Martha Kusumah: rewritten and tested in MQL5, published on AlgoToolbox. MT5 port source code on GitHub.
Frequently Asked Questions
Does Streak Reversal MT5 repaint?
The current-bar signals, labels, checklist, EMA color and buffer flags recalculate and can change before the close. Use the last completed candle for confirmed output. History or configuration changes can alter a rebuild. The first-opposite marker is also deliberately drawn one bar back after qualification. An absolute repainting claim would hide those distinctions.
Does it open trades or manage the displayed stop?
No. The entry, SL and TP lines are chart references. They aren’t broker orders, and the indicator doesn’t size or manage a position. A set freezing or being replaced only describes its display state, rather than a fill or an account result.
Which timeframe should we start with?
The examples cover BTCUSDc M30 and XAUUSDc H4/M5, not a search for the best timeframe. Start with the symbol and timeframe relevant to your intended workflow. Record the settings and inspect completed candles. Changing timeframe changes the pattern’s candles, not just how many labels fit on screen.
Can an EA read the signal buffers?
Yes. CopyBuffer indices 8, 9, 10 and 11 represent Long Trend, Long Counter, Short Trend and Short Counter. A qualifying bar holds 1.0; otherwise the value is EMPTY_VALUE. Read shift 1 for the completed candle and use a new-bar check to avoid acting repeatedly on the same signal. Execution, position sizing and risk management still need their own rules.
Final Verdict
We like Streak Reversal MT5 as an explanation tool for this candle pattern. It shows the difference between a turn that catches the eye and a sequence that meets the rules. The checklist is the main attraction; the labels and reference levels make more sense once you’ve read it.
Try the defaults and follow a few candidates through to the candle close. Keep the live preview, last confirmed signal and older reference lines separate. If the pattern earns a place in your trading plan, give position sizing, execution and exits the same attention. A completed checklist means the pattern qualified—not that the market owes it a profit.
Risk & Transparency Notice: All indicators, Expert Advisors, and Strategy Tester runs on AlgoToolbox are for educational and evaluation purposes only. Trading Forex and CFDs carries substantial financial risk, and backtest results do not guarantee live performance. Read our full Risk Disclaimer.